
Fig. 2
- ID
- ZDB-IMAGE-180911-41
- Antibodies
- Publication
- Oosterhof et al., 2018 - Colony-Stimulating Factor 1 Receptor (CSF1R) Regulates Microglia Density and Distribution, but Not Microglia Differentiation In Vivo
- All Figures
- Figures for Oosterhof et al., 2018
|
Fig. 2
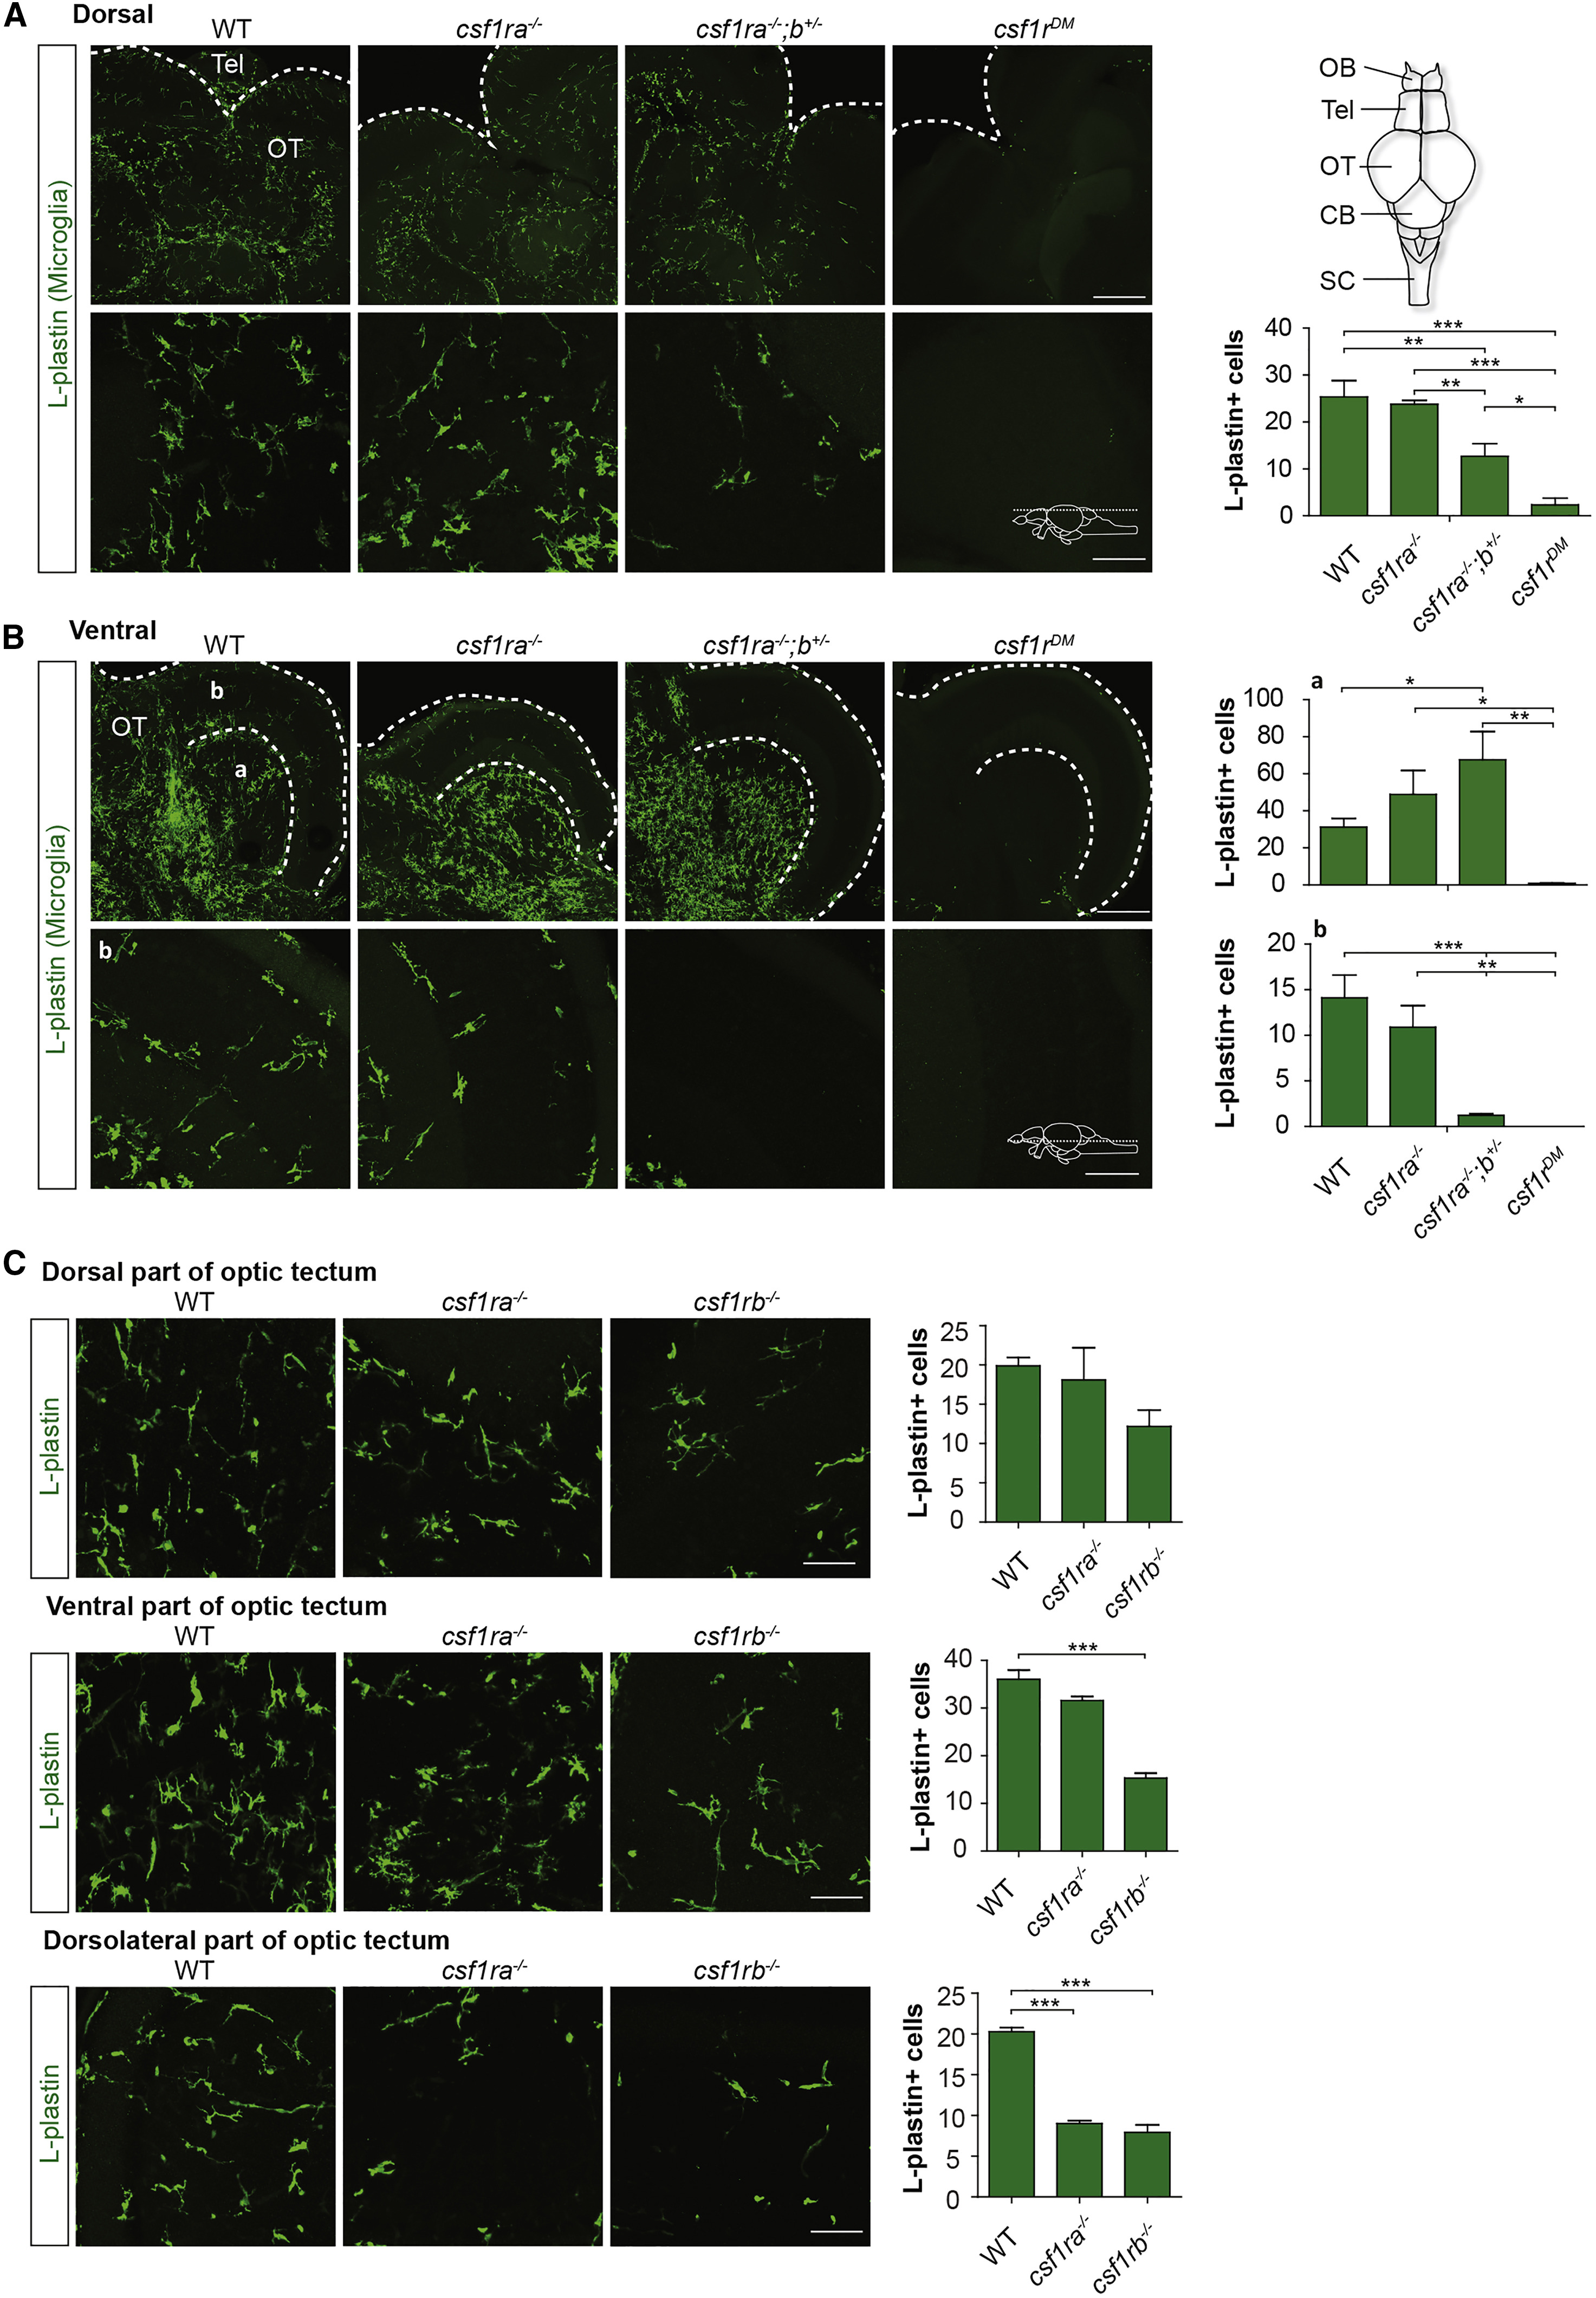
Altered Microglia Distribution and Numbers in the Adult csf1r Mutant Brain
(A) Representative images of microglia in WT, csf1ra−/−, csf1ra−/−;b+/−, and csf1rDM brain sections from zebrafish aged 5 months post fertilization (mpf), stained with antibody against L-plastin (n = 3 zebrafish/group).
(B) Microglia in (a) the ventral part of the optic tectum and (b) the dorsolateral part of the optic tectum of WT, csf1ra−/−, csf1ra−/−;b+/−, and csf1rDM.
(C) Representative images of microglia in WT, csf1ra−/−, and csf1rb−/− brain sections from 15 mpf zebrafish stained with antibody against L-plastin (n = 3 zebrafish/group).
Microglia were quantified in 3 areas (2.5 × 106 μm3) per brain region per animal. Error bars represent SD. ∗p < 0.05, ∗∗p < 0.01, ∗∗∗p < 0.001 (one-way ANOVA, Bonferroni multiple testing correction). Scale bars in (A) and (B), top, indicate 200 μm; in (A) and (B), bottom, and in (C), scale bars indicate 50 μm.