
IMAGE
Fig. S2
- ID
- ZDB-IMAGE-180911-28
- Genes
- Publication
- Guner-Ataman et al., 2018 - Failed Progenitor Specification Underlies the Cardiopharyngeal Phenotypes in a Zebrafish Model of 22q11.2 Deletion Syndrome
- All Figures
- Figures for Guner-Ataman et al., 2018
Image
|
Figure Caption
Fig. S2
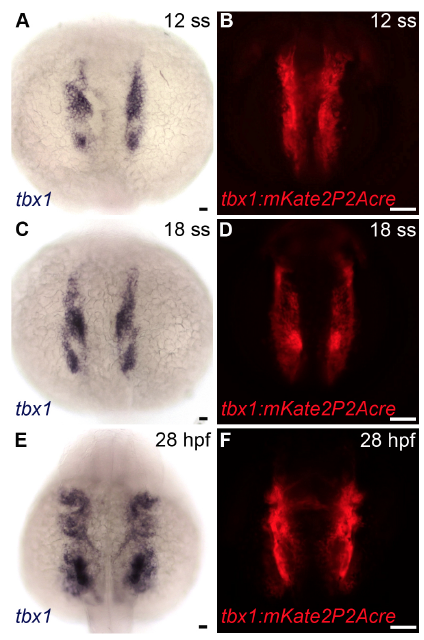
Recapitulation of the tbx1 expression pattern by mKate2 in Tg(tbx1:mKate2P2Acre) animals, Related to Figure 4.
(A-F) Brightfield (A, n=15; C, n=14; E, n=15) and fluorescent (B,D,F, n=40) images of 12 somite stage (ss). (A,B), 18 ss (C,D) and 28 hours post-fertilization (hpf) (E,F) wild-type zebrafish embryos processed by in situ hybridization with a tbx1 riboprobe (A,C,E) or live Tg(tbx1:mKate2P2Acre) animals imaged in the red channel. Dorsal views, anterior up. Little to no variation was observed between animals in each experimental group. Scale bars=25μm.
Figure Data
Acknowledgments
This image is the copyrighted work of the attributed author or publisher, and
ZFIN has permission only to display this image to its users.
Additional permissions should be obtained from the applicable author or publisher of the image.
Full text @ Cell Rep.