
Fig. S1
- ID
- ZDB-IMAGE-180911-27
- Genes
- Publication
- Guner-Ataman et al., 2018 - Failed Progenitor Specification Underlies the Cardiopharyngeal Phenotypes in a Zebrafish Model of 22q11.2 Deletion Syndrome
- All Figures
- Figures for Guner-Ataman et al., 2018
|
Fig. S1
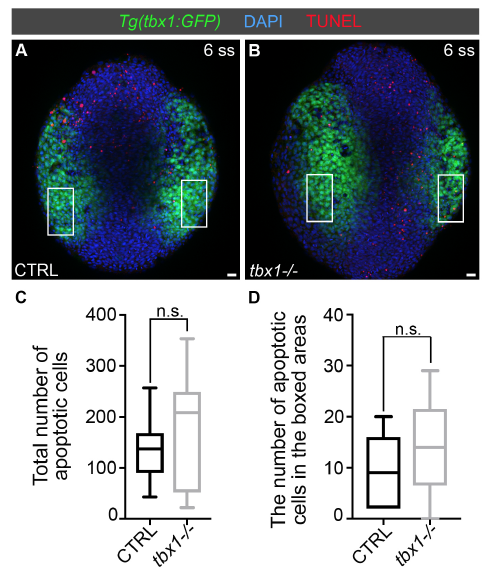
tbx1 mutants do not display elevated rates of apoptosis in anterior lateral plate mesoderm, Related to Figure 3.
(A, B) Confocal z-stacks of 6 somite stage (ss) control (CTRL; A, n=14) and tbx1 mutant (B, n=8) Tg(tbx1:GFP) embryos processed for TUNEL labeling (red), immunostained to detect GFP (green), and counterstained with DAPI (blue). The boxed regions encompass the approximate locations of nkx2.5+ progenitors. Dorsal views, anterior up. (C, D) Box and whisker plots showing the distribution of total apoptotic cells (C) or apoptotic cells within the boxed areas (D) per embryo in each experimental group. n.s., non significant as determined by unpaired, two-tailed t-test. Scale bars=25mm.