
|
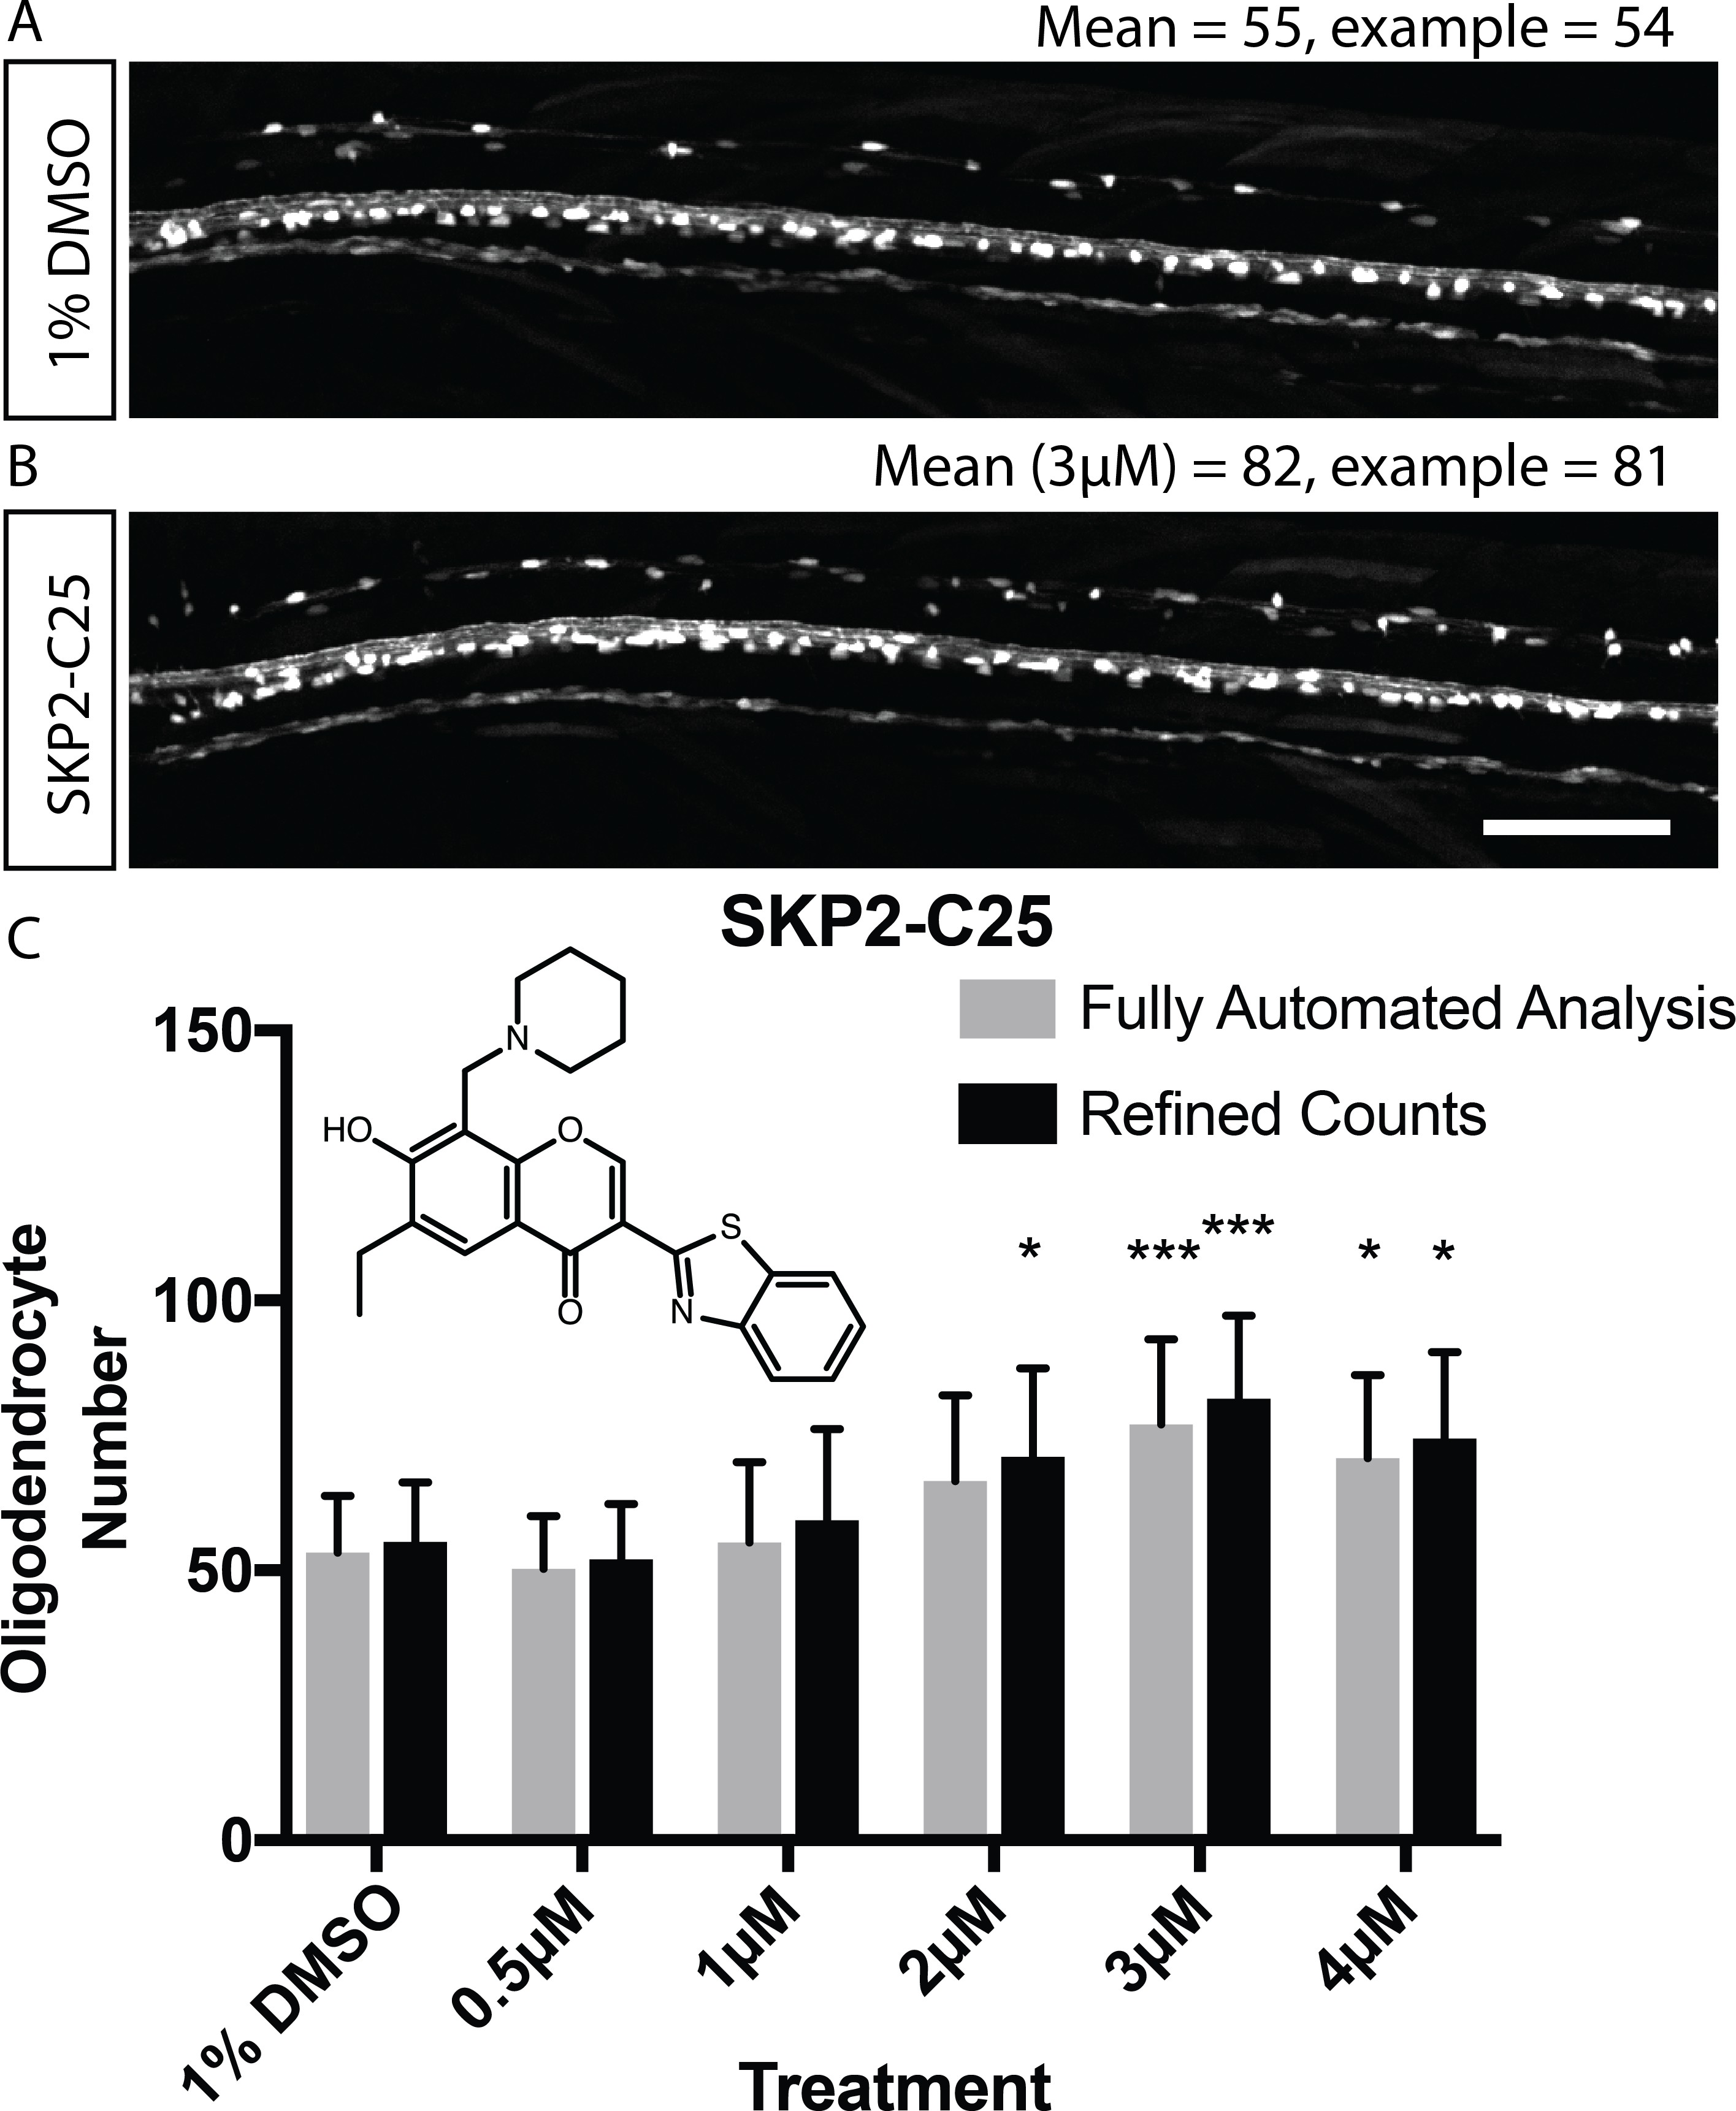
Fig. 4
Validation of automated image analysis to identify changes in myelinating cell number induced by chemical hit.
(A, B) Confocal images of Tg(mbp:EGFP) control (A) and SKP2-C25-treated (B) animals reflecting mean cell number per treatment (numbers refer to entire dorsal spinal cord, not magnified area of same animals). Scale bar = 100 µm. (C) Quantitation of cell number in control and SKP2-C25 treated animals using fully automated (grey bars) and refined counts, auto ROIs (black bars). Two-way ANOVA followed by Dunnett’s multiple comparison test was used to assess statistical significance, with multiple comparison adjusted P value presented as *p<0.05, ***p<0.001. Error bars represent means ± s.d.