
Fig. 1
- ID
- ZDB-IMAGE-180905-19
- Publication
- Akle et al., 2017 - Circadian Kinetics of Cell Cycle Progression in Adult Neurogenic Niches of a Diurnal Vertebrate
- All Figures
- Figures for Akle et al., 2017
|
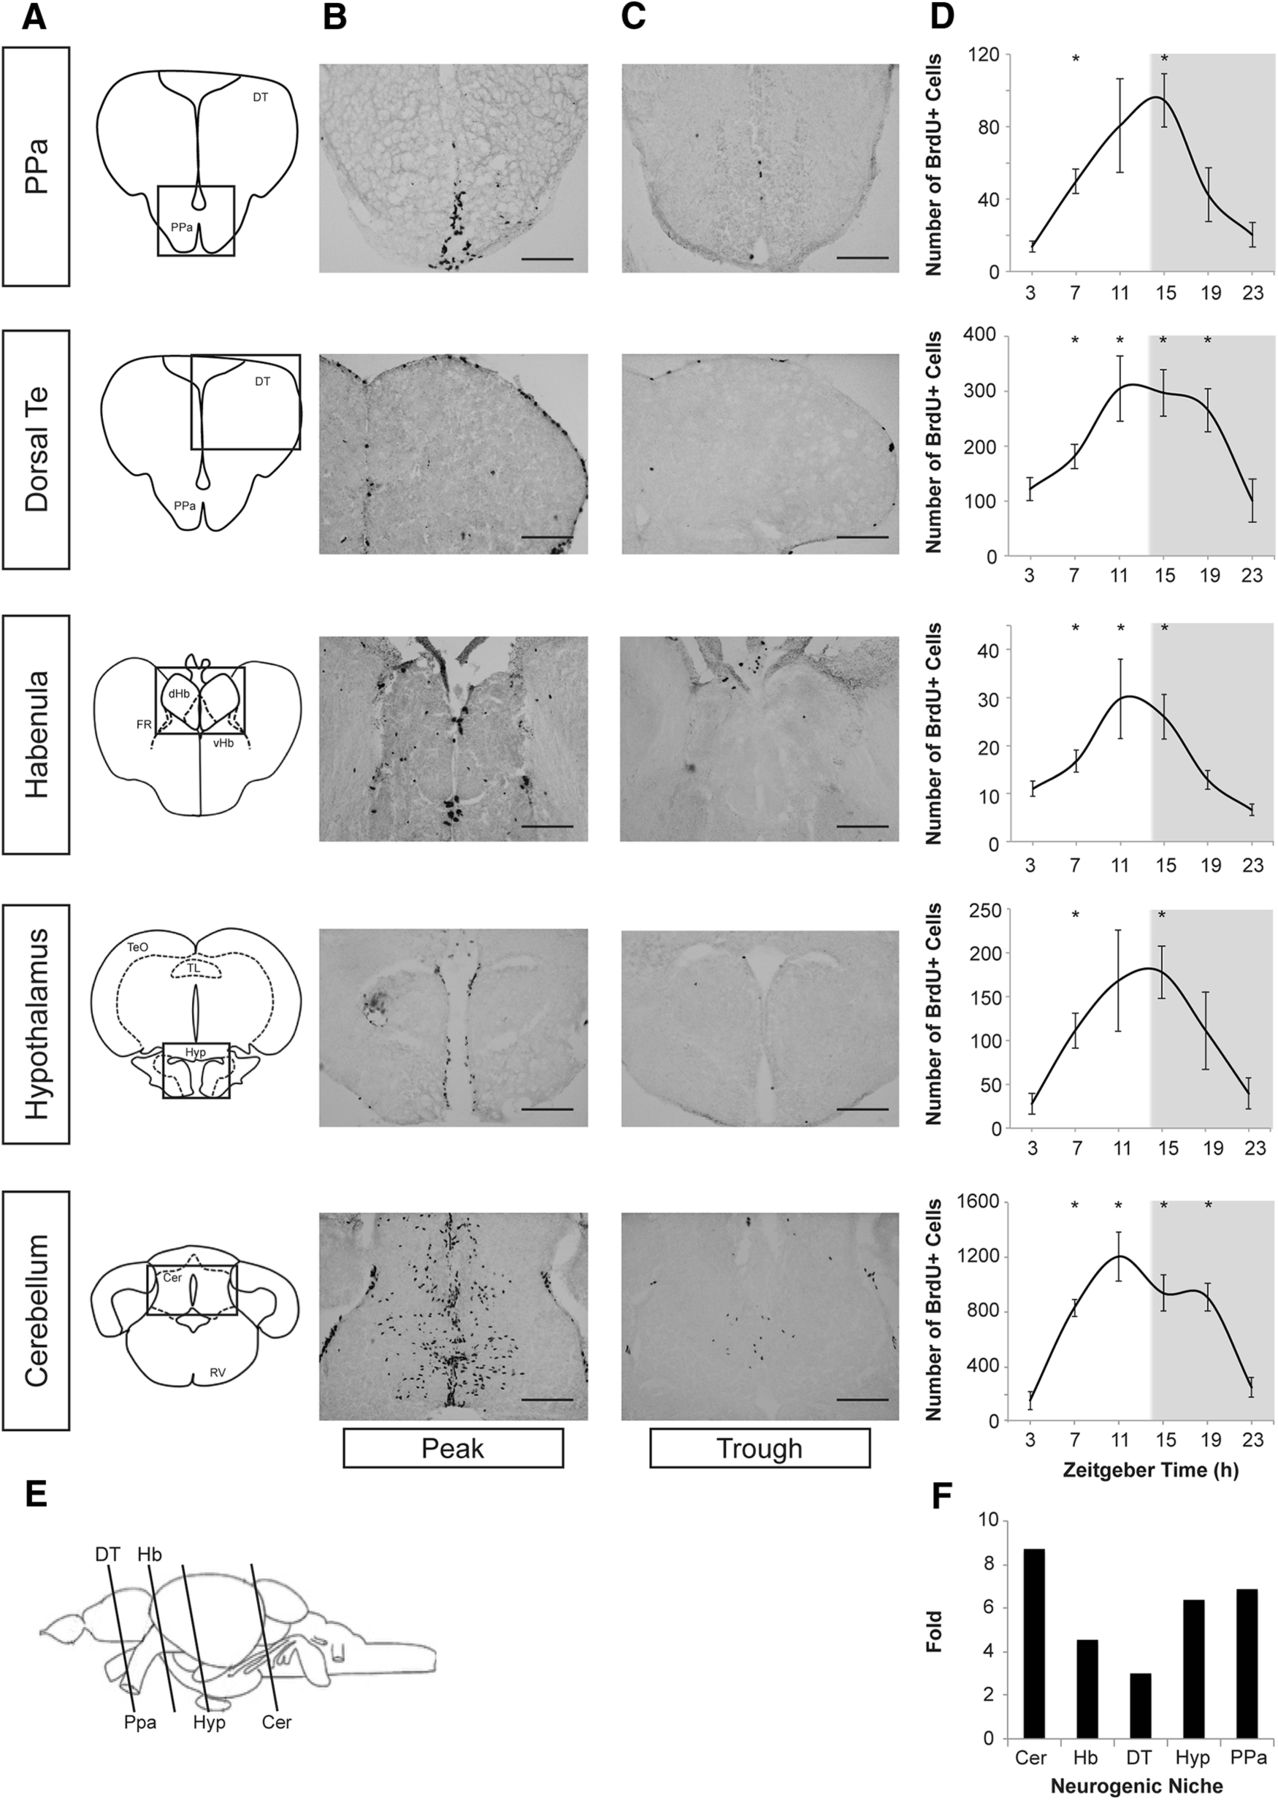
Fig. 1
Daily pattern of S phase of the cell division cycle in five neurogenic niches of adult zebrafish brain. A, Schematic of five neurogenic niches of adult zebrafish brain, with boxes identifying the areas presented in B and C. B, C, Representative images of daily variation in the number of BrdU+ cells in each niche, at daily trough (B) and peak (C), as presented in D. Scale bars, 50 μm. D, Number of BrdU+ cells undergoing S phase within each neurogenic niche, documented at 4 h intervals over a 24 h period. n = 4–6 fish per time point; mean ± SEM; *p < 0.05 relative to the trough in BrdU+ cells for a specific niche. The gray background indicates night, 14:10 LD cycle. Samples were collected at specified ZT, after a 4 h in vivo exposure to BrdU. ZT0 is lights-on time. E, Schematic of zebrafish brain identifying coronal planes at which the brain was cut to evaluate BrdU+ cells presented in B–D. F, Range of circadian oscillation, the ratio of the number of BrdU-labeled cells at peak and trough in each niche (folds).