
Fig. 2
- ID
- ZDB-IMAGE-180828-73
- Genes
- Antibodies
- Publication
- Wang et al., 2018 - Triptolide attenuates proteinuria and podocyte apoptosis via inhibition of NF-κB/GADD45B
- All Figures
- Figures for Wang et al., 2018
|
Fig. 2
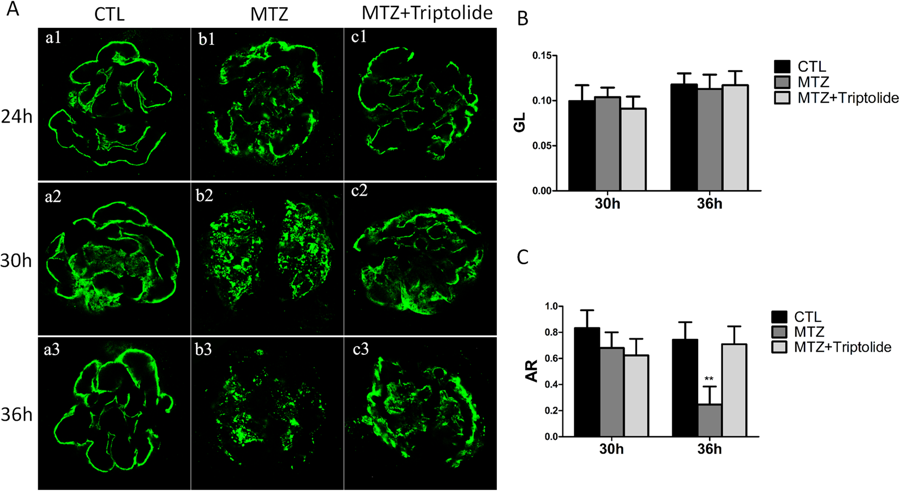
The effects of triptolide on podocin expression and distribution in MTZ-treated Tg(pod:gal4;UAS:NTR-mCherry) zebrafish. (A) The expression and distribution of podocin in different groups was measured and examined at 24 h, 30 h and 36 h after MTZ treatment in 84 hpf larvae; (a1–a3) normal control (CTL); (b1–b3) MTZ model group; (c1–c3) MTZ + triptolide group. (B) No obvious mean immunofluorescence intensity (GL) differences were observed between the three groups at 30 h and 36 h. (C) Positively stained area to the glomerular area (AR) revealed a remarkably reduction at 36 h in the MTZ model group, but remained strong in the triptolide treatment group. (n = 3), **P < 0.01, (original magnification, x1000).