
Fig. S6
- ID
- ZDB-IMAGE-180828-47
- Publication
- Phan et al., 2018 - Neutrophils use superoxide to control bacterial infection at a distance
- All Figures
- Figures for Phan et al., 2018
|
Fig. S6
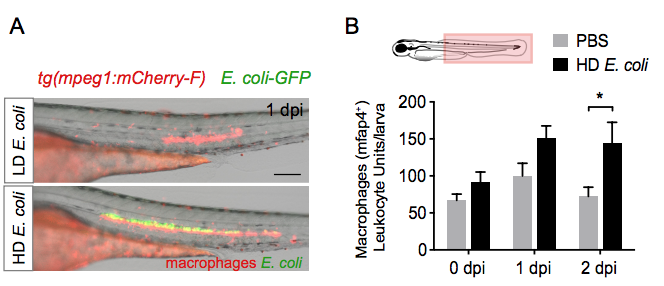
High dose infection in the notochord leads to increased macrophage population.
(A) Two dpf tg(mpeg1:mCherry-F) larvae were injected in the notochord either with low dose (LD) or high dose (HD) E. coli-GFP. Trunk regions were imaged using fluorescence microscopy at 1 dpi. Scale bar: 200 μM. Representative fluorescence (mCherry and GFP) overlaid with bright field images shows macrophage accumulation around the notochord in both LD and HD infections. Bacteria proliferate in HD infection. (B) Two dpf tg(mfap4:mCherry-F) larvae were injected in the notochord either with PBS or high dose E. coli-GFP. Counts of macrophages in the trunk and tail region by Leukocyte Unite quantification (LU) in indicated conditions (mean values ± SEM, Mann Whitney’s test, two-tailed, NPBS = 12–14 and NHD = 6–9, *p<0.05). Larva diagram shows the region of counting.