
Fig. S2
- ID
- ZDB-IMAGE-180828-43
- Publication
- Phan et al., 2018 - Neutrophils use superoxide to control bacterial infection at a distance
- All Figures
- Figures for Phan et al., 2018
|
Fig. S2
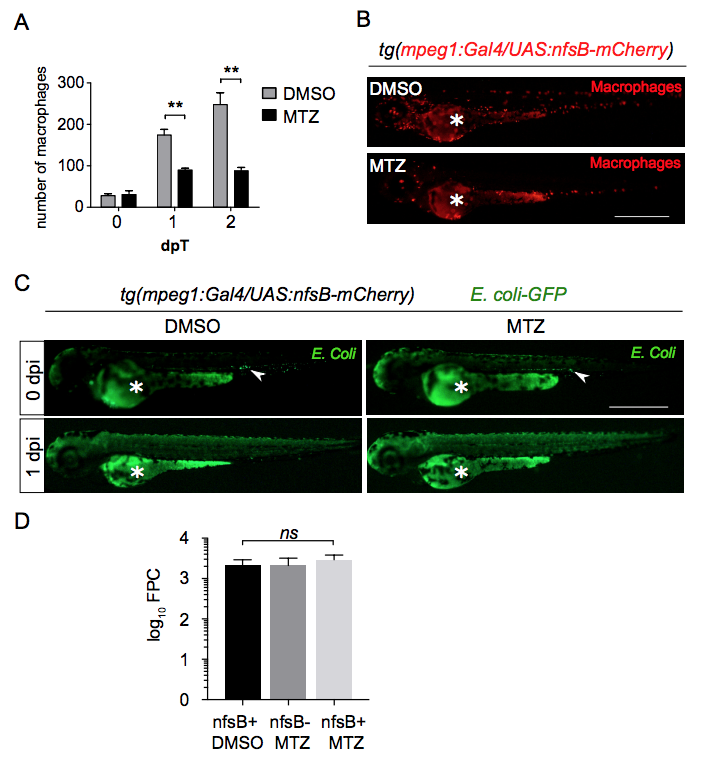
Macrophages ablation using Nitroreductase/Metronidazole system does not affect bacterial growth during notochord infection.
(A-B) Tg(mpeg1:Gal4/UAS:nfsB-mCherry) larvae were treated either with DMSO or Metronidazole (MTZ) added in fish water at 35 hpf. Treated larvae were imaged at 0, 1 and 2 days post-treatment (dpT) using fluorescence microscopy. (A) Quantification of total macrophages in DMSO and MTZ treated larvae at 0 and 1 and 2 dpT (Mean number of cell/larva ± SEM, NDMSO = 5 and NMTZ = 5, three independent experiments, Mann-Whitney test, one-tailed, **p<0.005). (B) Representative fluorescent images (DsRed) of DMSO and MTZ treated larvae at 1 dpT. Asterisk: auto-fluorescence of the yolk. Scale bar: 600 μm. (C) At 1 dpT larvae were infected with E. Coli-GFP in the notochord. Representative fluorescent images (GFP) showing infection outcome at 0 and 1 dpi for two indicated conditions. Asterisk: auto-fluorescence of the yolk, white arrowhead: E. Coli-GFP injection site. Scale bar: 600 μm. (D) Bacterial load quantification by Fluorescent Pixel Count (FPC) in MTZ treated Tg(mpeg1:Gal4/UAS:nfsB-mCherry) (nfsB+ MTZ) at 1 dpi showing no significant differences in the bacterial load with control groups (Tg(mpeg1:Gal4/UAS:nfsB-mCherry) treated with DMSO referred as nfsB+ DMSO and non transgenic siblings treated with MTZ referred as nfsB- MTZ) (mean values ± SEM, Kruskall-Wallis test with Dunn’s post-test, NnfsB+ DMSO = 13, NnfsB- MTZ = 7, NnfsB+ MTZ = 13).