
Fig. 1
- ID
- ZDB-IMAGE-180828-29
- Publication
- Marsden et al., 2018 - A Cyfip2-Dependent Excitatory Interneuron Pathway Establishes the Innate Startle Threshold
- All Figures
- Figures for Marsden et al., 2018
|
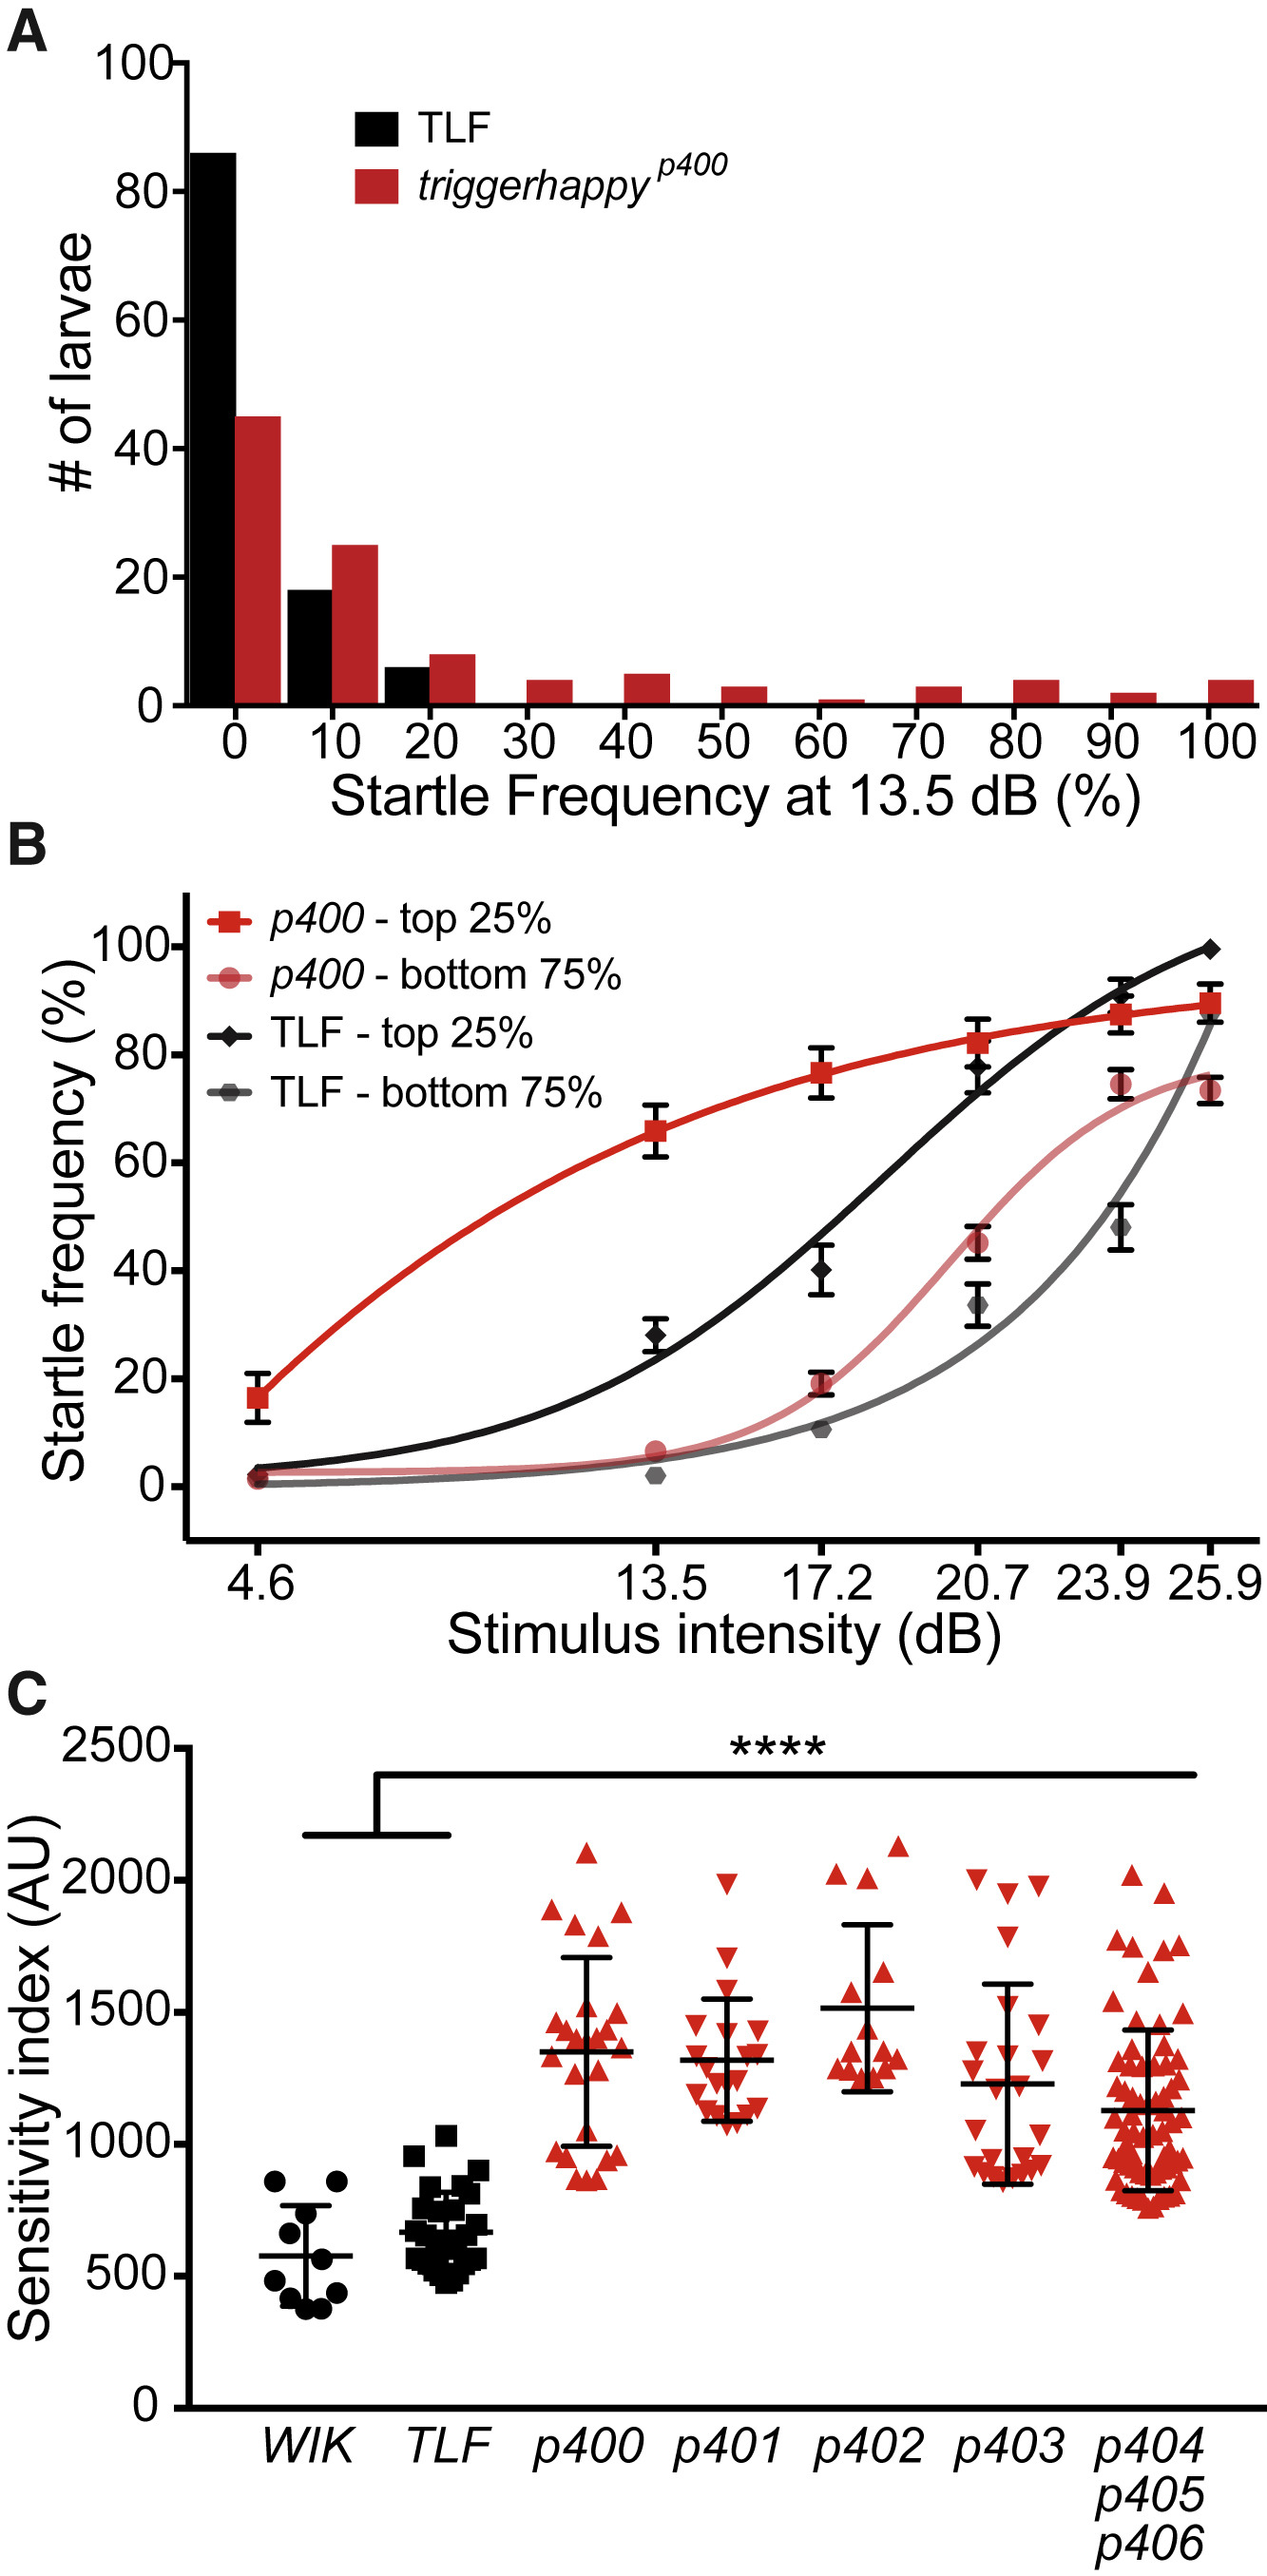
Fig. 1 The Startle Threshold Is Reduced in Mutants from the Forward Genetic Screen (A) Distribution of startle response frequency to 10 low-intensity (13.5 dB) stimuli in 5 dpf wild-type TLF larvae (black bars, n = 110) and larvae from a cross of triggerhappyp400 carriers (red bars, n = 104). (B) Startle frequency for 10 trials at each of 6 intensities with sigmoidal fit curves. triggerhappyp400 and TLF larvae were split into two groups: putative mutants (top 25%; p400, red line; TLF, black line) and putative siblings (bottom 75%; p400, pink line; TLF, gray line) based on their startle response frequency at 13.5 dB (mean ± SEM). (C) Startle sensitivity indices. The area under the curves in (B) are displayed for the top 25% of WIK and TLF (black circles and squares, mean ± SD) and 7 mutant lines (red triangles; p400-406; ∗∗∗∗p < 0.0001, one-way ANOVA with Dunnett’s multiple comparison test).