
Fig. 4
- ID
- ZDB-IMAGE-180827-78
- Genes
- Antibodies
- Publication
- Tseng et al., 2018 - Modeling Niemann-Pick disease type C1 in zebrafish: a robust platform for in vivo screening of candidate therapeutic compounds.
- All Figures
- Figures for Tseng et al., 2018
|
Fig. 4
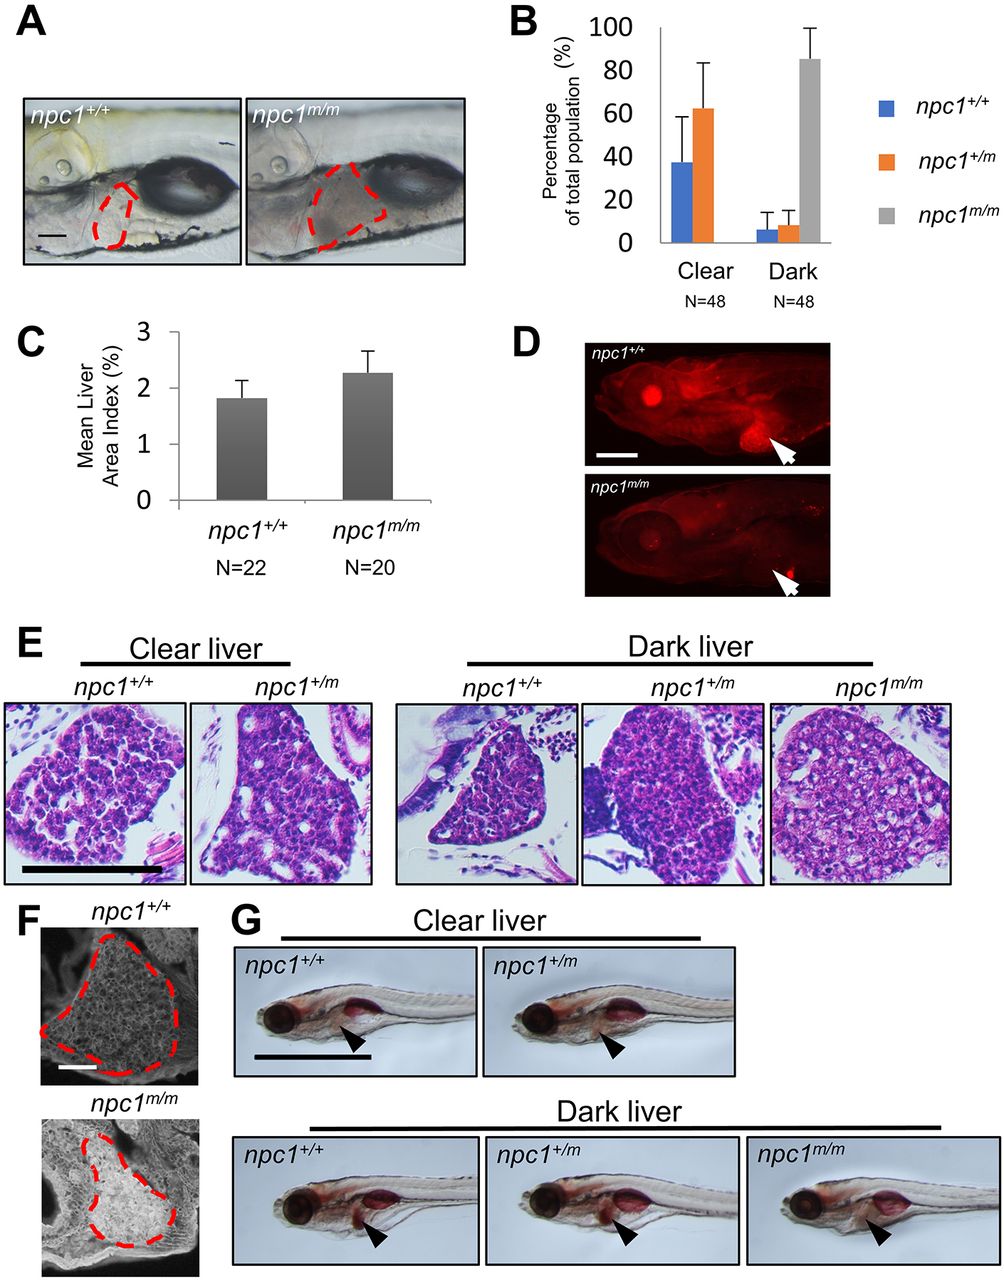
Liver pathology in npc1m/m larvae. (A) Lateral live images of npc1+/+ and npc1m/m 7 dpf larvae. The area corresponding to liver is outlined by the red dashed line. Scale bar: 100 μm. (B) 7 dpf zebrafish larvae were separated by liver phenotype (clear versus dark) and then genotyped. A small proportion of npc1+/+ or npc1+/m larvae had a dark liver phenotype. In contrast, all npc1m/m larvae had the dark liver phenotype. (C) Liver size was quantified by measuring the lateral view area corresponding to the liver tissue and normalized to the total lateral body projection area (area index) in 7 dpf larvae. Liver size was significantly (P<0.001, two-tailed t-test) increased in npc1m/m larvae compared to npc1+/+ control larvae. (D) Immunofluorescence images of 7 dpf wild-type and npc1m/m stained with anti-NPC1 antibody. Arrows point to the liver. NPC1 staining is absent in the npc1m/m liver tissue. Scale bar: 200 μm. (E) H&E staining of liver tissue from 7 dpf npc1+/+ and npc1+/− larvae with the clear liver phenotype, and npc1+/+, npc1+/m and npc1m/m larvae with the dark liver phenotype. Scale bar: 50 μm. (F) Filipin staining of 7 dpf npc1+/+ and npc1m/m larvae. Liver tissue is outlined. Scale bar: 50 μm. (G) Oil Red O staining of 7 dpf larvae sorted with respect to clear/dark liver phenotype and genotype. Arrowheads point to the liver. Scale bar: 1 mm.