
|
Fig. 5
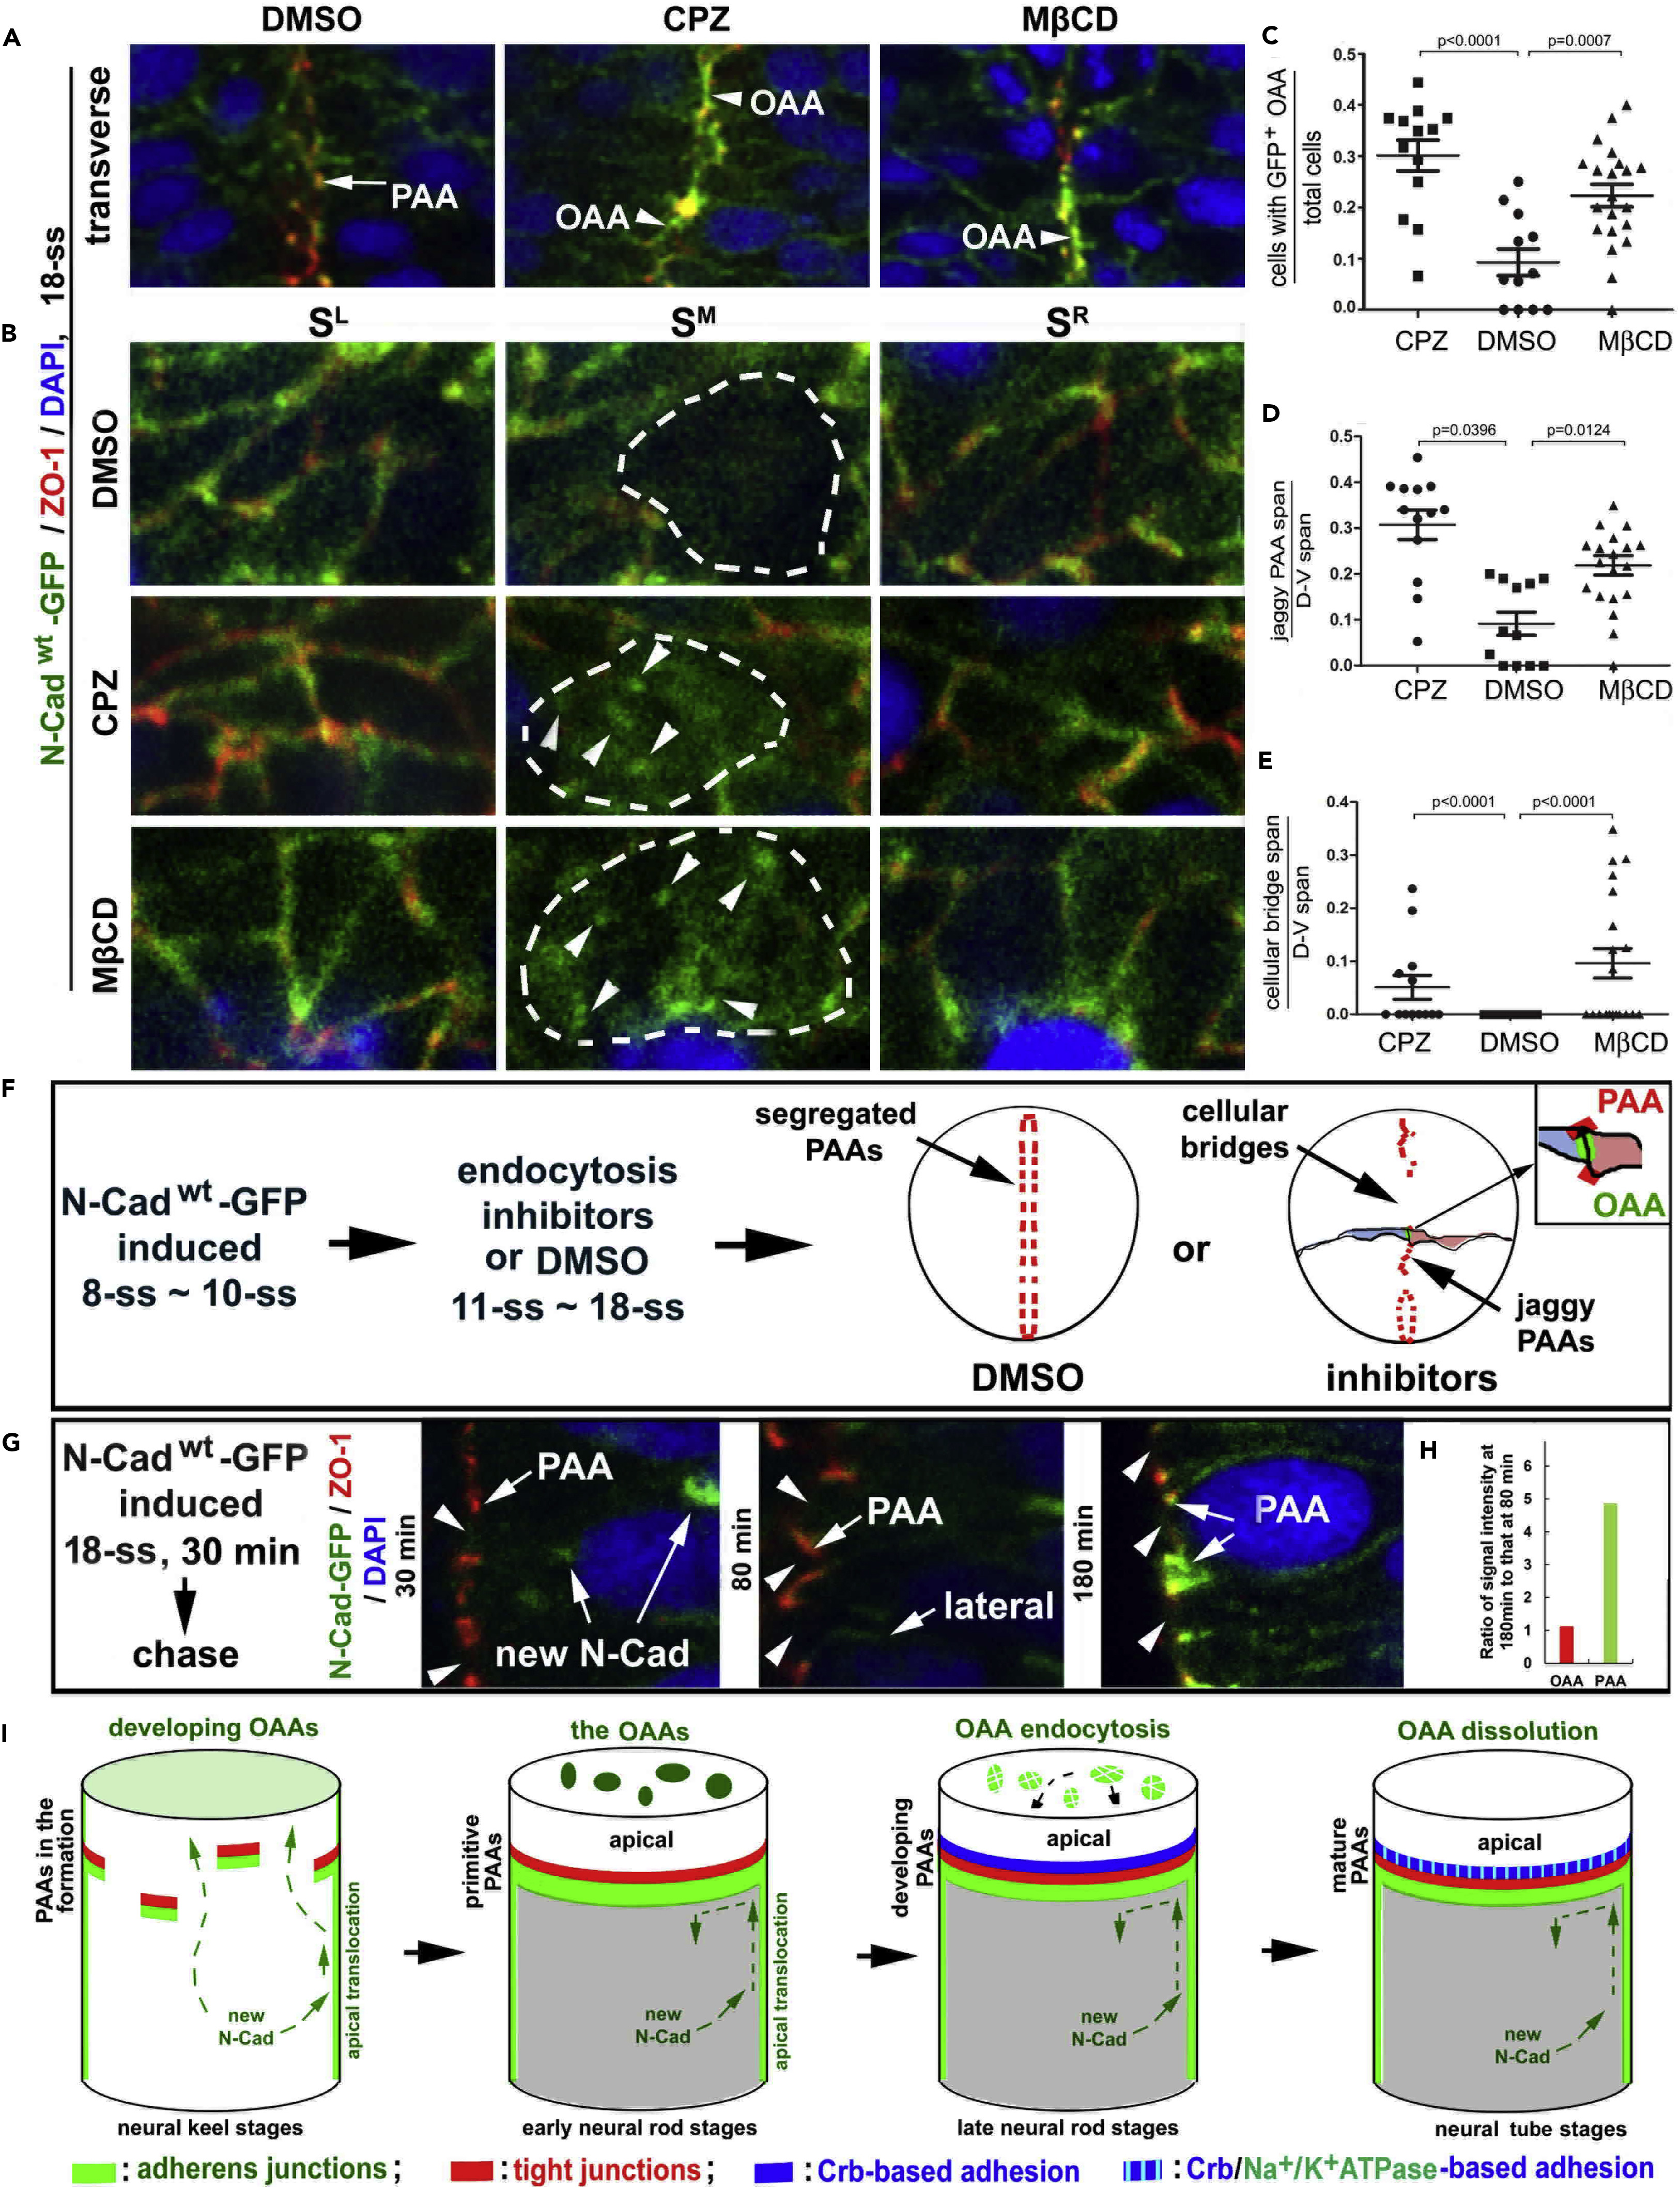
OAA Dissolution Depends on Endocytosis and Restriction of Apical Translocation of N-Cad
(A) Effects of treatments with endocytosis inhibitors CPZ (N = 13 embryos) and MβCD (N = 20 embryos) on the apical adhesions in Tg(HSP70:N-Cadwt-GFP)pt137 embryos at 18-ss. Note that inhibition of endocytosis resulted in jaggy midline alignment of ZO-1 and accumulation of N-Cad-GFP at the opposing apical surface (arrowheads); however, in DMSO controls, the PAAs (arrows) segregated into two parallel planes flanking the midline and the OAAs dissolved. Panels are magnifications of the boxed regions in the bottom row of panels in Figure S5F.
(B) Serial sagittal imaging of the apical adhesions revealed the retention of the N-Cad-GFP at the OAAs (arrowheads, SM sections) in embryos treated with either CPZ (N = 12 embryos) or MβCD (N = 12 embryos), but not in DMSO control (N = 4 embryos). The opposing apical surfaces are circled with dashed lines.
(C–E) Individual-value bar graphs (with means ± SEM) illustrate the ratios between cells displaying N-Cadwt-GFP signals at the OAA region and total cells (C), the ratios between jaggy ZO-1 positive PAA span and dorsal-ventral (D-V) span (D), and the ratios between cellular bridge span and D-V span (E). The numbers of Type I and II embryos analyzed (Figures S5B and S5C) are 13 for CPZ, 20 for MβCD, and 12 for DMSO. p Values by two-tailed Student's t test.
(F) A scheme summarizes the treatments and effects described in A–D.
(G and H) N-Cadwt-GFP, when heat-shock-expressed for 30 min (starting at 18-ss), first appeared inside the cells 30 min later (arrows new N-Cad), then on the lateral cell membranes 80 min later (arrow lateral), and finally enriched at the PAAs (arrows PAA) 180 min later. Note that N-Cadwt-GFP never localized to the opposing apical surfaces (arrowheads) at any time. The changes of N-Cadwt-GFP signal intensities at the apical regions were quantified as ratios between 180-min chase (N of OAA sites = 59; N of PAA sites = 118) and 80-min chase (N of OAA sites = 45; N of PAA sites = 90); note no changes at the opposing apical surfaces and a five times increase at the PAAs (H).
(I) Diagrams summarize the formation of primitive, developing, and mature PAAs, which block the apical translocation of newly synthesized N-Cad from the lateral membranes; the OAAs eventually dissolve by endocytosis. Also see Figure S5.