
Image
|
Figure Caption
Fig. 2
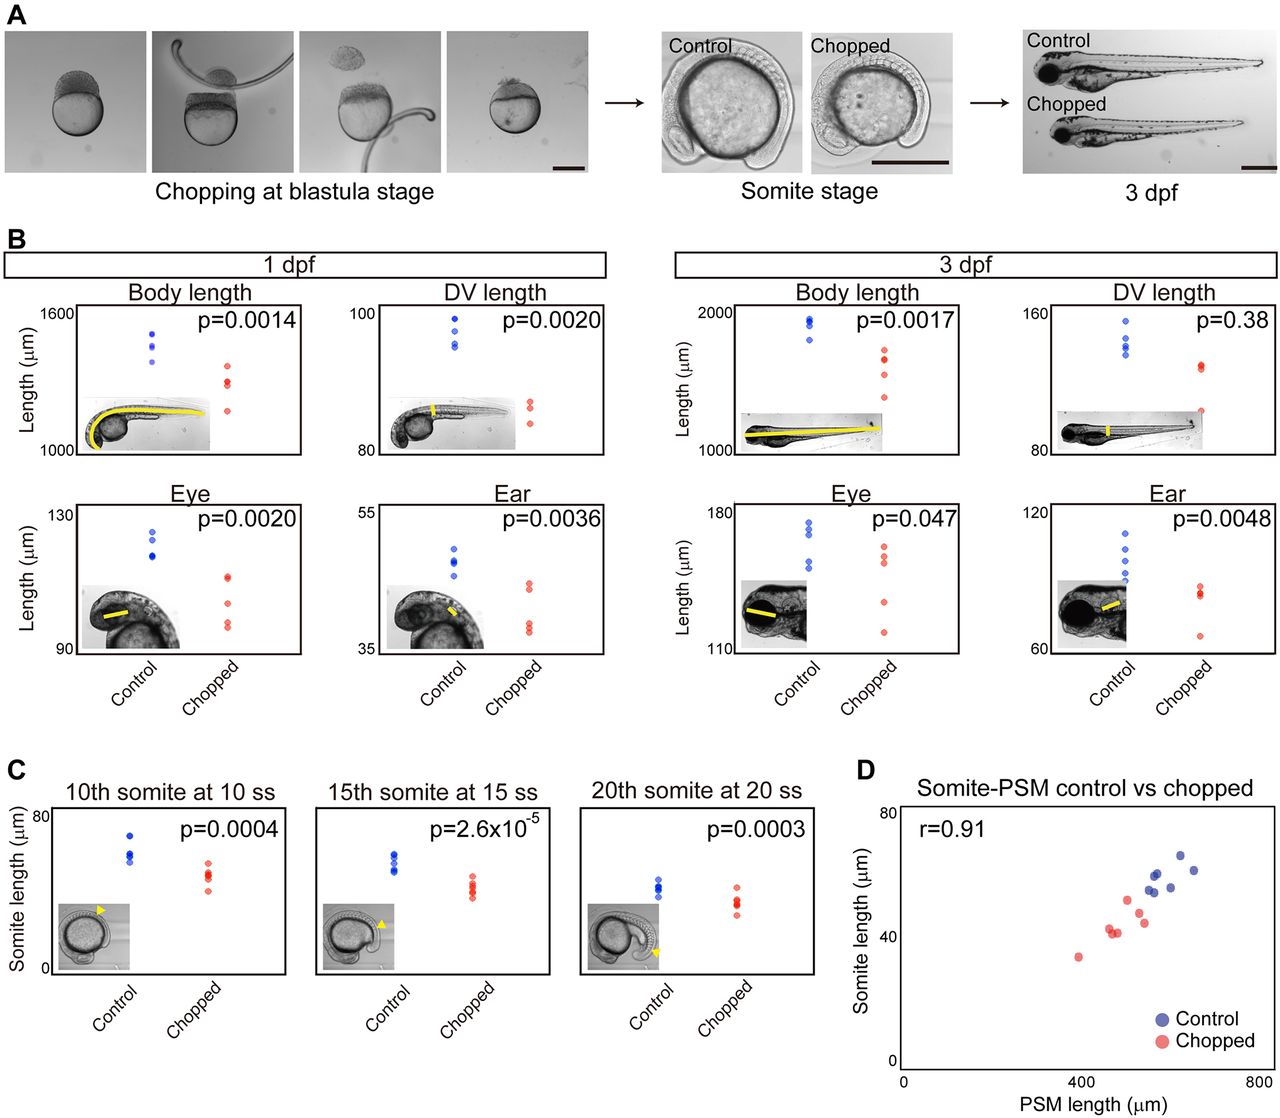
Somite scaling between individuals of different sizes. (A) Size reduction technique. Scale bars: 500 μm. dpf, days post-fertilization. (B) Comparison of body and organ sizes between control and chopped embryos. Insets illustrate the region measured. n=5 each. (C) Comparison of somite size between control and chopped embryos. Somite of interest indicated by arrowhead in insets. n=5 each. (D) Somite size versus PSM size in control and chopped embryos. n=7 each.
Acknowledgments
This image is the copyrighted work of the attributed author or publisher, and
ZFIN has permission only to display this image to its users.
Additional permissions should be obtained from the applicable author or publisher of the image.
Full text @ Development