
Fig. 6
- ID
- ZDB-IMAGE-180820-13
- Publication
- Madelaine et al., 2018 - A screen for deeply conserved non-coding GWAS SNPs uncovers a MIR-9-2 functional mutation associated to retinal vasculature defects in human
- All Figures
- Figures for Madelaine et al., 2018
|
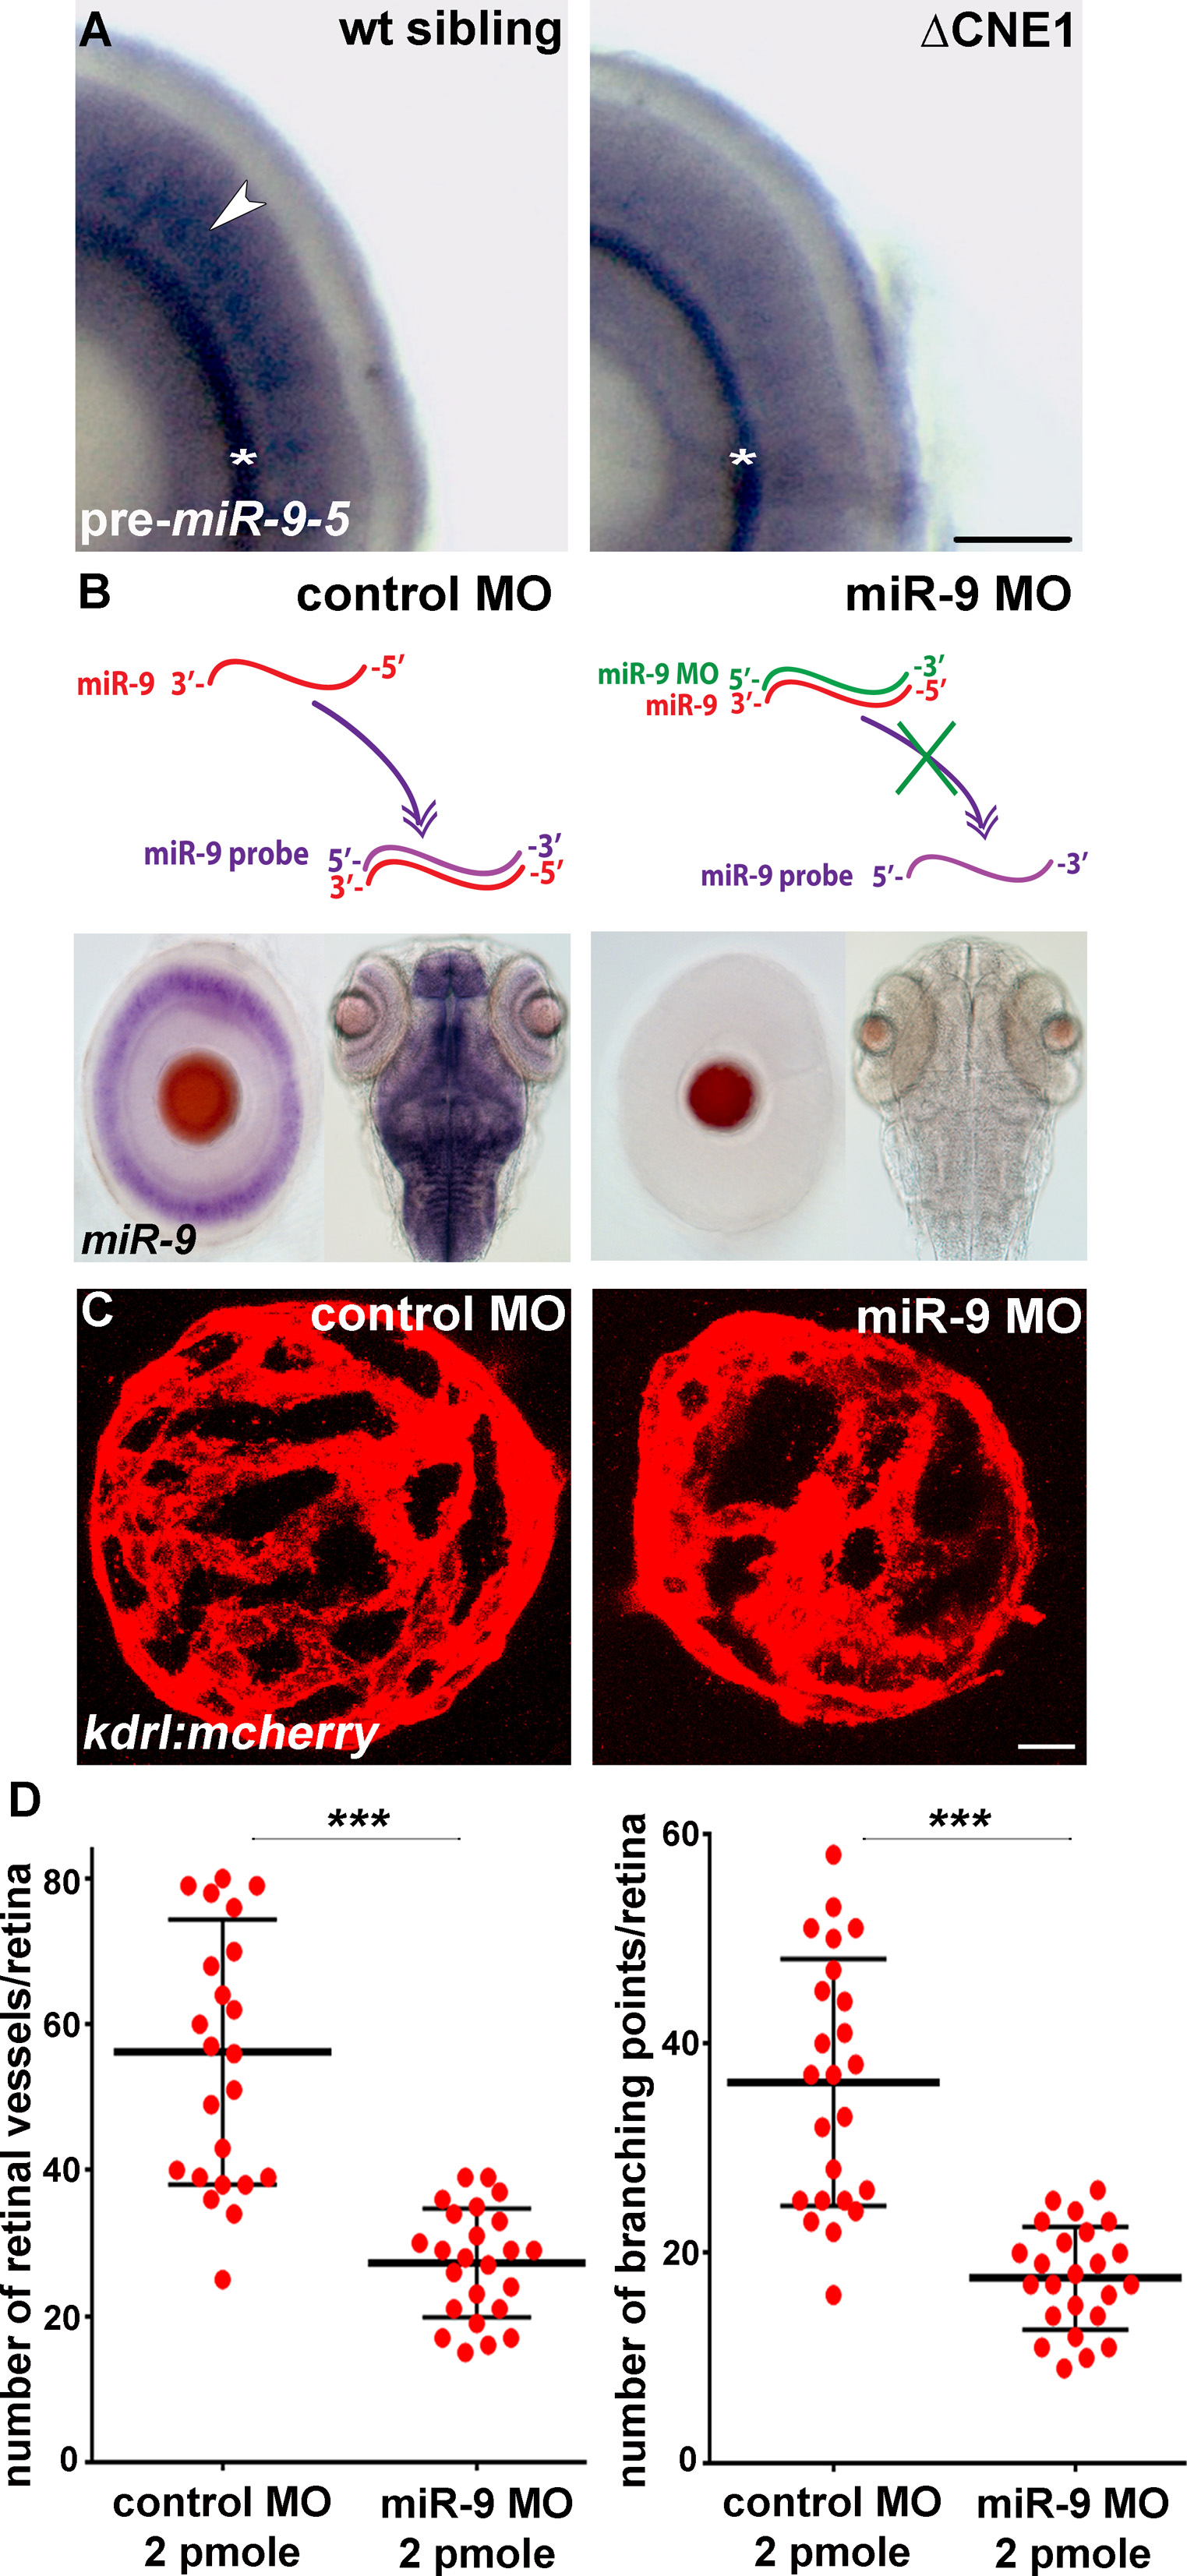
Fig. 6
miR-9 controls retinal vasculature development. (A) Whole-mount ISH against pre-miR-9-5 in control and ΔCNE1 mutant retina at 72 hpf. In 88% of the mutant retinas (n = 43), miR-9-5 expression is reduced or absent, compared to the control larvae (n = 34). Arrowheads show miR-9-5 expression in the inner nuclear layer of the retina. Asterisk shows background staining with the pre-miR-9-5 LNA probe that is not observed with the LNA probe targeting the mature miR-9 sequence (see Figure 4C and panel (B)). (B) Schematic representation of the miR-9 MO binding to microRNA-9. With the control MO, miR-9 is freely available revealing the miR-9 expression pattern with the specific miR-9 LNA probe. In presence of the miR-9 MO, miR-9 is bound by the MO inhibiting the binding of the LNA probe. miR-9 morphant larvae show no obvious defects in the brain and eye morphogenesis compared to the control MO. (C) Confocal projections of mCherry immunolabeling in Tg(kdrl:mCherry) retina at 72 hpf showing hyaloid vasculature formation in control MO and miR-9 MO injected larvae. (D) Quantification of the hyaloid vasculature network organization observed in the control MO or the miR-9 MO at 72 hpf. A minimum of 24 retinas was analyzed for each context. Dorsal view of the brain with anterior up. Lateral view of the retina. Scale bars: 100 μm (A) or 10 μm (C). Error bars represent s.d. *P < 0.05, **P < 0.001, ***P < 0.0005, determined by t-test, two-tailed.