
Fig. 2
- ID
- ZDB-IMAGE-180809-14
- Publication
- Fleming et al., 2018 - Rapamycin attenuates pathological hypertrophy caused by an absence of trabecular formation
- All Figures
- Figures for Fleming et al., 2018
|
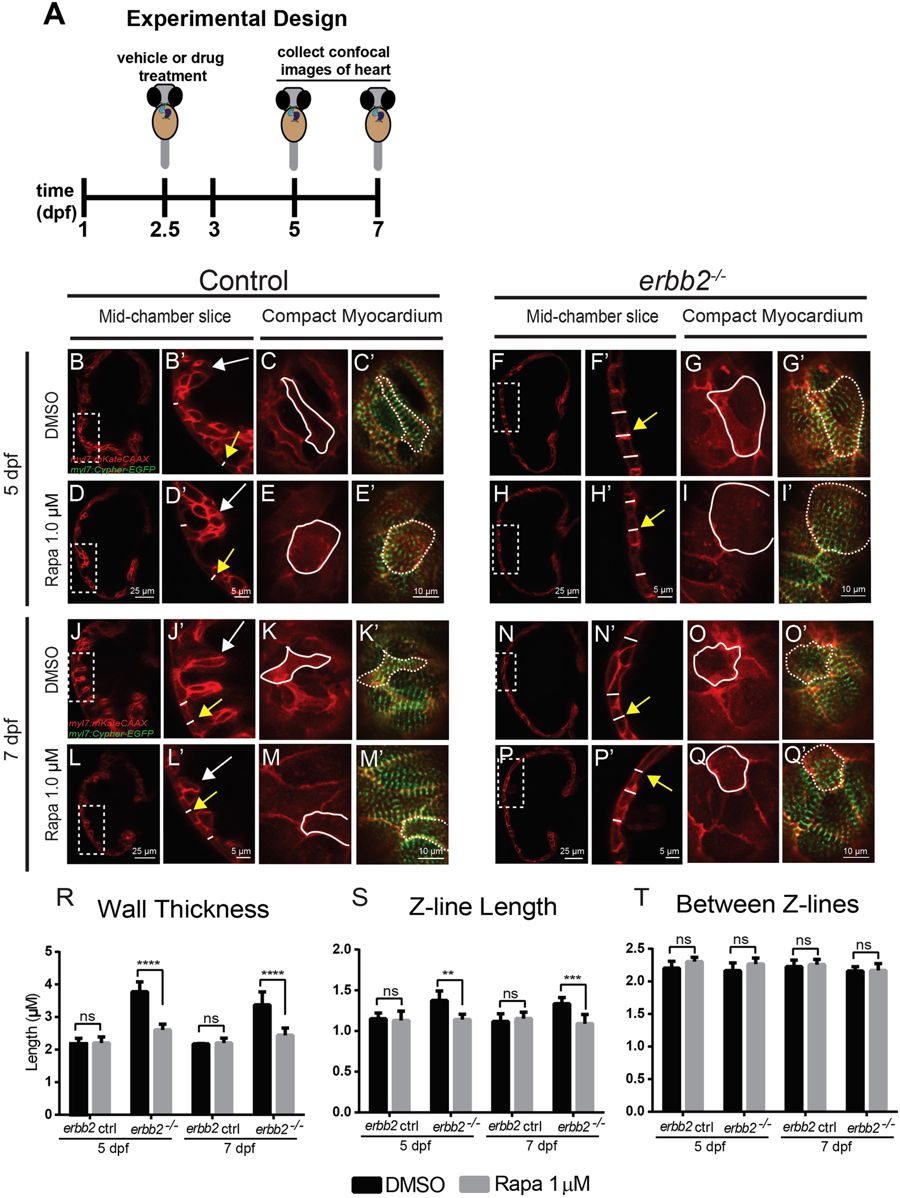
Fig. 2
Inhibition of TOR signaling attenuates erbb2 mutant HL phenotypes (A) Schematic of experimental design. (B,D,F,H,J,L,N,P) Mid-chamber confocal sections of control and erbb2−/− hearts treated with DMSO or rapamycin at 5 and 7 dpf. (B’,D’,F’,H’,J’,L’,N’,P’) Magnified high-resolution images of compact myocardial wall and trabecular regions marked by dotted box in (B,D,F,H,J,L,N,P). Yellow arrows point to length of CM along compact myocardial wall. White arrows point to trabeculae. (C-C’,E-E’,G-G’,I-I’) Magnified high-resolution images of compact myocardium revealing sarcomere structures of CMs at 5 dpf. (K-K’,M-M’,O-O’,Q-Q’) Magnified high-resolution images of compact myocardium revealing sarcomere structures of CMs at 7 dpf. (R–T) Quantification of compact myocardial wall thickness (n = 7–15), Z-line length (n = 5–10), and distance between Z-lines (n = 5–12) at 5 and 7 dpf from DMSO or rapamycin-treated control and erbb2−/− hearts. Data are represented as mean ± SEM. **p = 0.0035, ***p = 0.0003, and ****p < 0.0001 by Student’s t test.