
Image
|
Figure Caption
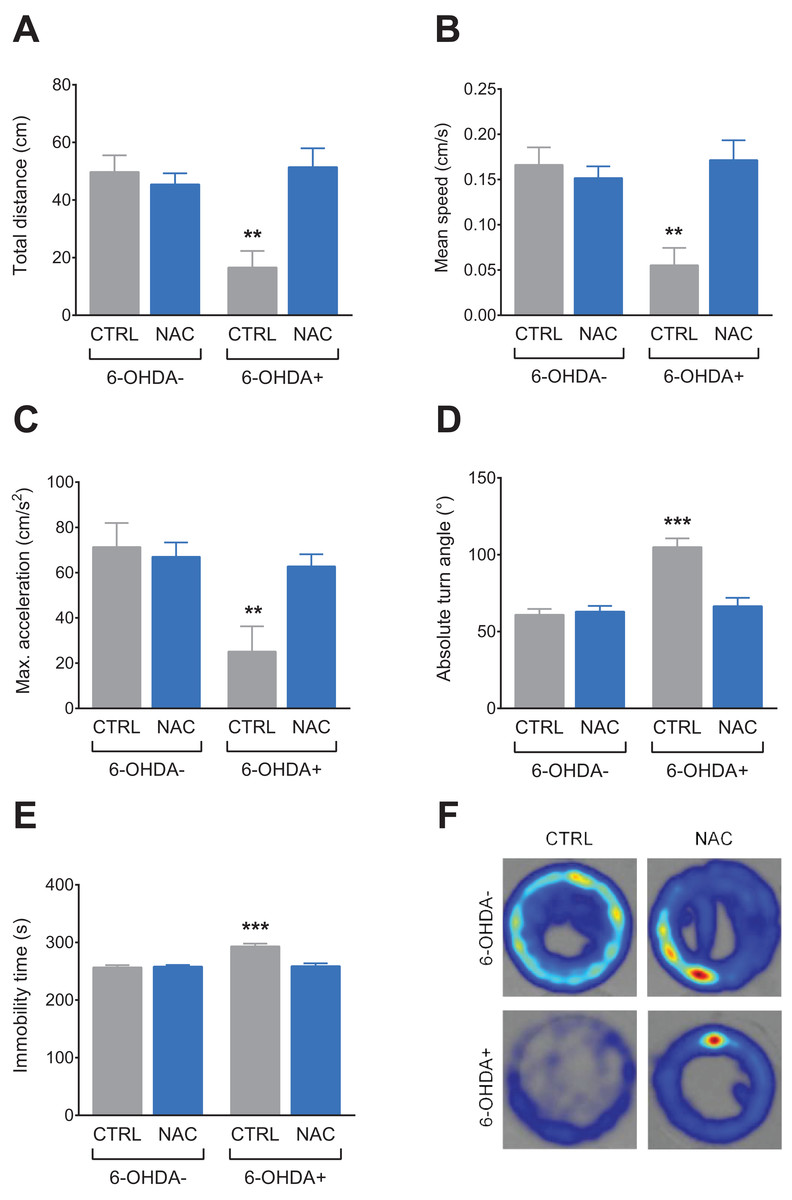
Fig. 2
Effects of NAC on 6-OHDA-induced locomotor behavior deficits in zebrafish larvae.(A) Total distance travelled, (B) mean speed, (C) maximum acceleration, (D) absolute turn angle, (E) immobility time and (F) representative color heatmap of the behavior of one larvae from each treatment group during the trial 5 min duration. Data are expressed as mean ± standard error of mean (S.E.M.). n = 8–11. Two-way ANOVA followed by Bonferroni post hoc test. Study sites: CTRL, control; NAC, N-acetylcysteine; 6-OHDA, 6-hydroxydopamine. **p < 0.01, ***p < 0.001 vs. control group (6-OHDA-).
Figure Data
Acknowledgments
This image is the copyrighted work of the attributed author or publisher, and
ZFIN has permission only to display this image to its users.
Additional permissions should be obtained from the applicable author or publisher of the image.
Full text @ Peer J.