
Fig. 1
- ID
- ZDB-IMAGE-180808-27
- Publication
- Martín-Jiménez et al., 2018 - Reduction of the ATPase inhibitory factor 1 (IF1) leads to visual impairment in vertebrates.
- All Figures
- Figures for Martín-Jiménez et al., 2018
|
Fig. 1
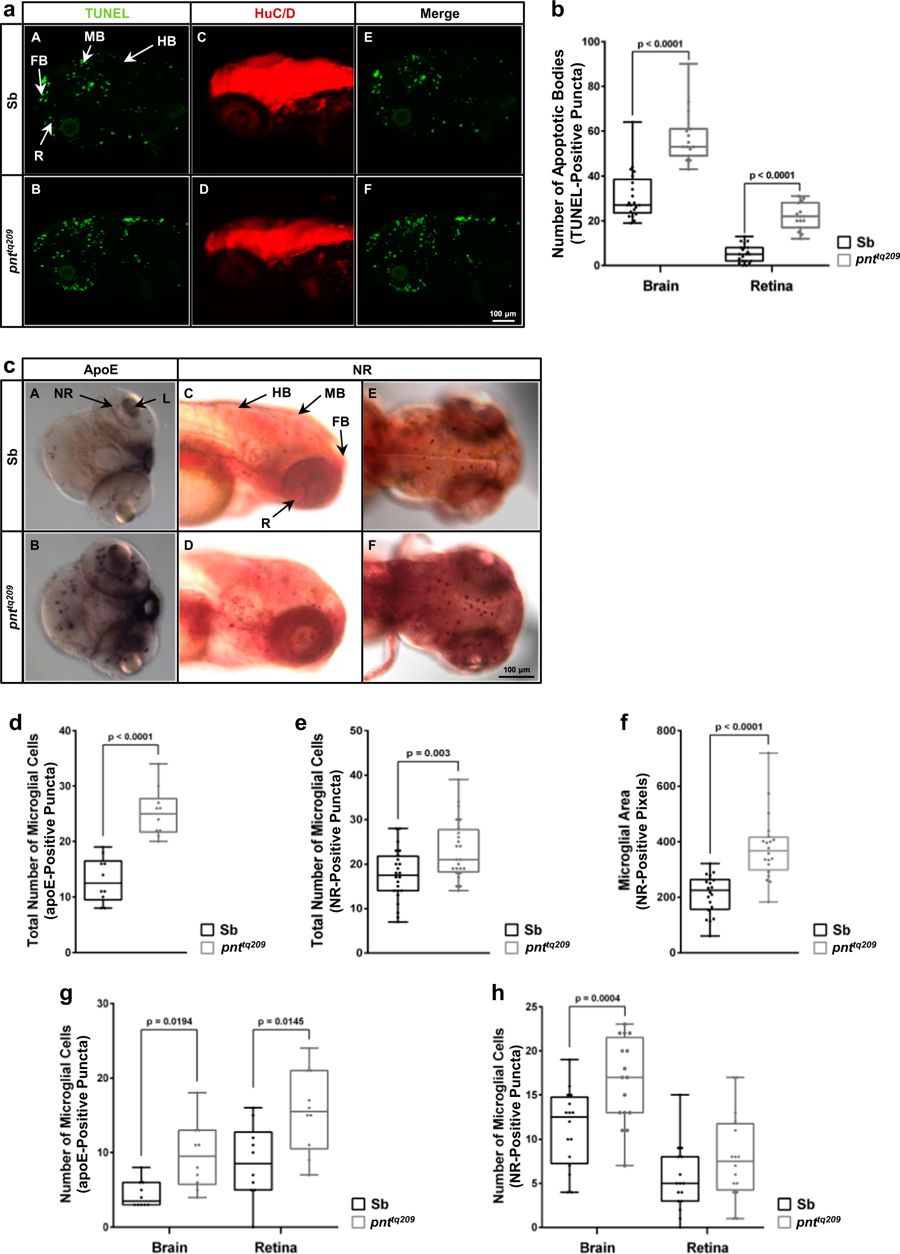
a TUNEL assay (A, B) and HuC/D (C, D) immunostaining of PTU-treated normal Sb and pnttq209 mutant zebrafish at 72 hpf to detect apoptotic cells and differentiated neurons, respectively. The merge between the two fluorescent signals is shown in E and F. b Quantification of apoptotic bodies, detected with the TUNEL assay, in Sb and pnttq209 zebrafish, showing a significant increase in the total number of apoptotic bodies in the brain and retina of mutant larvae (number of apoptotic bodies (TUNEL-positive puncta) in the brain, Sb: 31.10 ± 2.35, pnttq209: 57.53 ± 3.12; in the retina, Sb: 5.33 ± 0.85, pnttq209: 21.80 ± 1.52; results are reported as mean ± S.E.M. (n = 15–20)). c apoE in situ hybridization (A, B) and NR staining (C–F) were carried out in PTU-treated, 72 hpf zebrafish to visualise microglia. d, e Quantification of apoE-positive (d) and NR-positive (e) cells in the whole CNS. A significant increase in the number of microglial cells characterizes pnttq209 zebrafish ((number of apoE-positive puncta, Sb: 13.10 ± 1.28, pnttq209: 25.20 ± 1.38; number of NR-positive puncta, Sb: 17.50 ± 1.18, pnttq209: 23.13 ± 1.35; results are reported as mean ± S.E.M. (apoE: n = 10; NR: n = 24)). f Analysis of the size of NR puncta. pnttq209 zebrafish showed a significant increase in the size of microglia when compared to Sb (microglial area (NR-positive pixels), Sb: 210.45 ± 15.65, pnttq209: 379.35 ± 26.73; results are reported as mean ± S.E.M. (n = 15)). g, h Evaluation of the number of cells stained with apoE (g) and NR (h) in the brain and retina, separately. The results demonstrate that, in pnttq209 larvae, the increase in microglial cell population is also extended to the retina ((number of apoE-positive puncta in the brain, Sb: 4.40 ± 0.56, pnttq209: 9.60 ± 1.38; in the retina, Sb: 8.70 ± 1.58, pnttq209: 15.60 ± 1.73; number of NR-positive puncta in the brain, Sb: 11.19 ± 1.10, pnttq209: 16.50 ± 1.21; in the retina, Sb: 5.44 ± 0.93, pnttq209: 7.94 ± 1.23; results are reported as mean ± S.E.M. (apoE: n = 10; NR: n = 15)). FB forebrain, HB hindbrain, MB midbrain, R retina