
Fig. 5
- ID
- ZDB-IMAGE-180808-13
- Antibodies
- Publication
- Yang et al., 2018 - Interaction of hepatic stellate cells with neutrophils and macrophages in the liver following oncogenic kras activation in transgenic zebrafish
- All Figures
- Figures for Yang et al., 2018
|
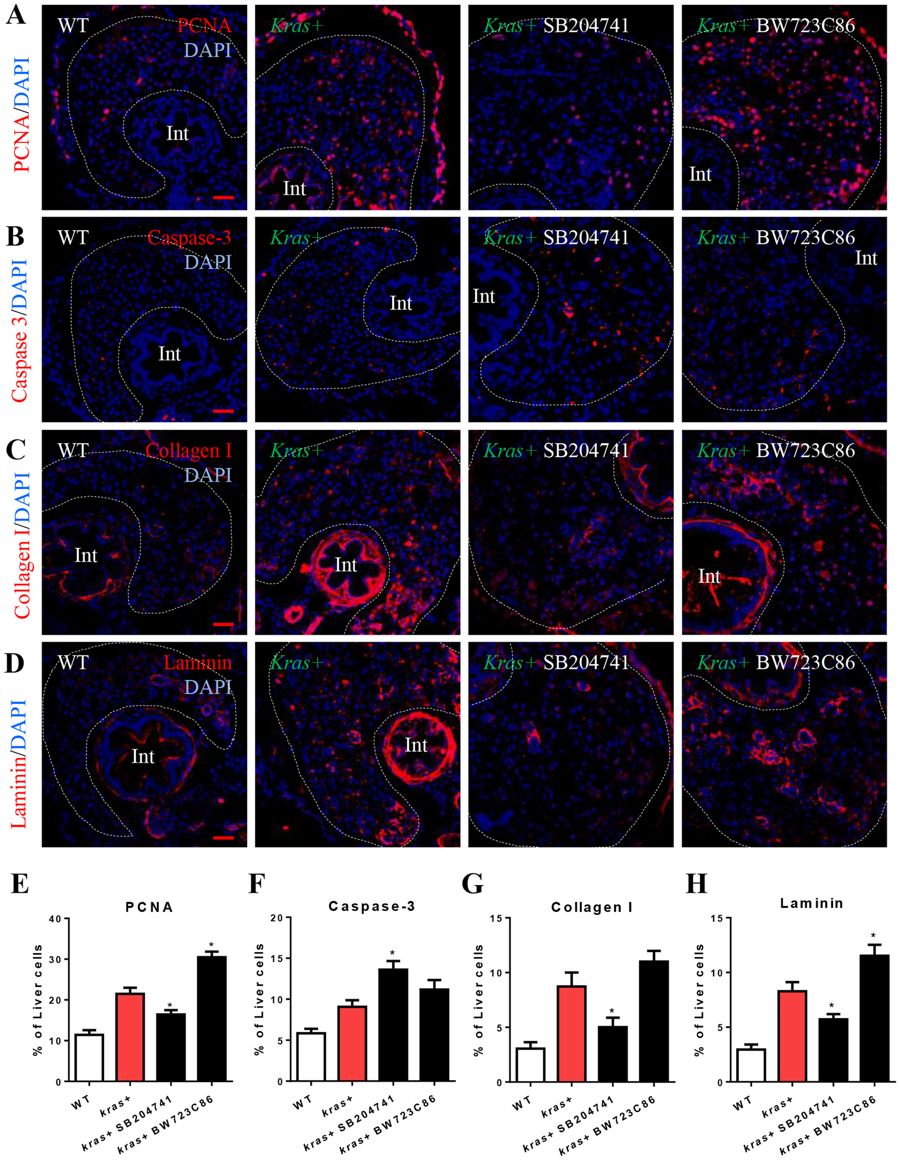
Fig. 5
Effects of manipulation of Htr2b on hepatocarcinogenesis and liver fibrosis. 3-dpf wildtype or kras+ larvae were co-treated with dox and SB204741 or BW723C86 for 4 days. More than 20 fish were analyzed in each group. (A,E) IF staining of PCNA on liver sections (A) and quantification of PCNA positive cells (E). (B,F) IF staining of Caspase-3 on liver sections (B) and quantification of apoptotic cells (F). (C,G) IF staining of collagen I on liver sections (C) and quantification of percentage of collagen I positive area (G). (D,H) IF staining of Laminin on liver sections (D) and quantification of percentage of Laminin positive area (H). Livers are marked by dash lines. Arrows indicate examples of co-staining and Int indicates intestine. In all experiments, n = 20 for each group. *P < 0.05, compare to the the group in red. Error bars represented biological replicates. Scale bar: 20 μm.