
Fig. 4
- ID
- ZDB-IMAGE-180808-12
- Genes
- Antibodies
- Publication
- Yang et al., 2018 - Interaction of hepatic stellate cells with neutrophils and macrophages in the liver following oncogenic kras activation in transgenic zebrafish
- All Figures
- Figures for Yang et al., 2018
|
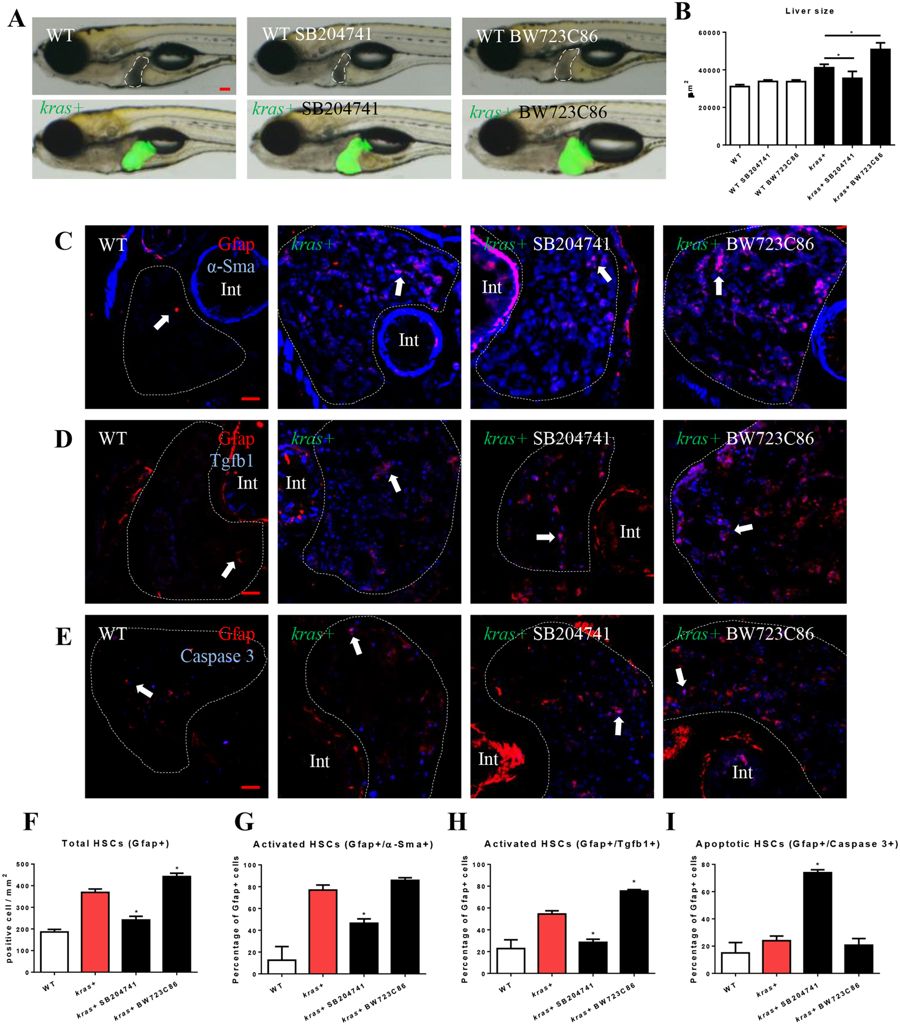
Fig. 4
Effects of manipulation of Htr2b on tumorigenesis and HSCs. 3-dpf wildtype or kras+ larvae were co-treated with dox and SB204741 or BW723C86 for 4 days. More than 20 fish were analyzed in each group. (A) Gross morphology of larvae in left lateral view after 4 days induction. (B) Quantification of 2D liver size. (C,F,G) IF co-staining of Gfap and α-Sma on liver sections (C) quantification of total HSC density (F) and activated HSCs (G). (D,H) IF co-staining of Gfap and Tgfb1 on liver sections (C) and quantification of Tgfb1-expressing HSCs (H). (E,I) IF co-staining of Gfap and Caspase-3 on liver sections and quantification of apoptotic HSCs (I). Livers are marked by dash lines. Arrows indicate examples of co-staining and Int indicates intestine. In all experiments, n = 20 for each group. *P < 0.05, compare to the the group in red. Error bars represented biological replicates. Scale bar: 20 μm.