
Fig. 2
- ID
- ZDB-IMAGE-180808-10
- Antibodies
- Publication
- Yang et al., 2018 - Interaction of hepatic stellate cells with neutrophils and macrophages in the liver following oncogenic kras activation in transgenic zebrafish
- All Figures
- Figures for Yang et al., 2018
|
Fig. 2
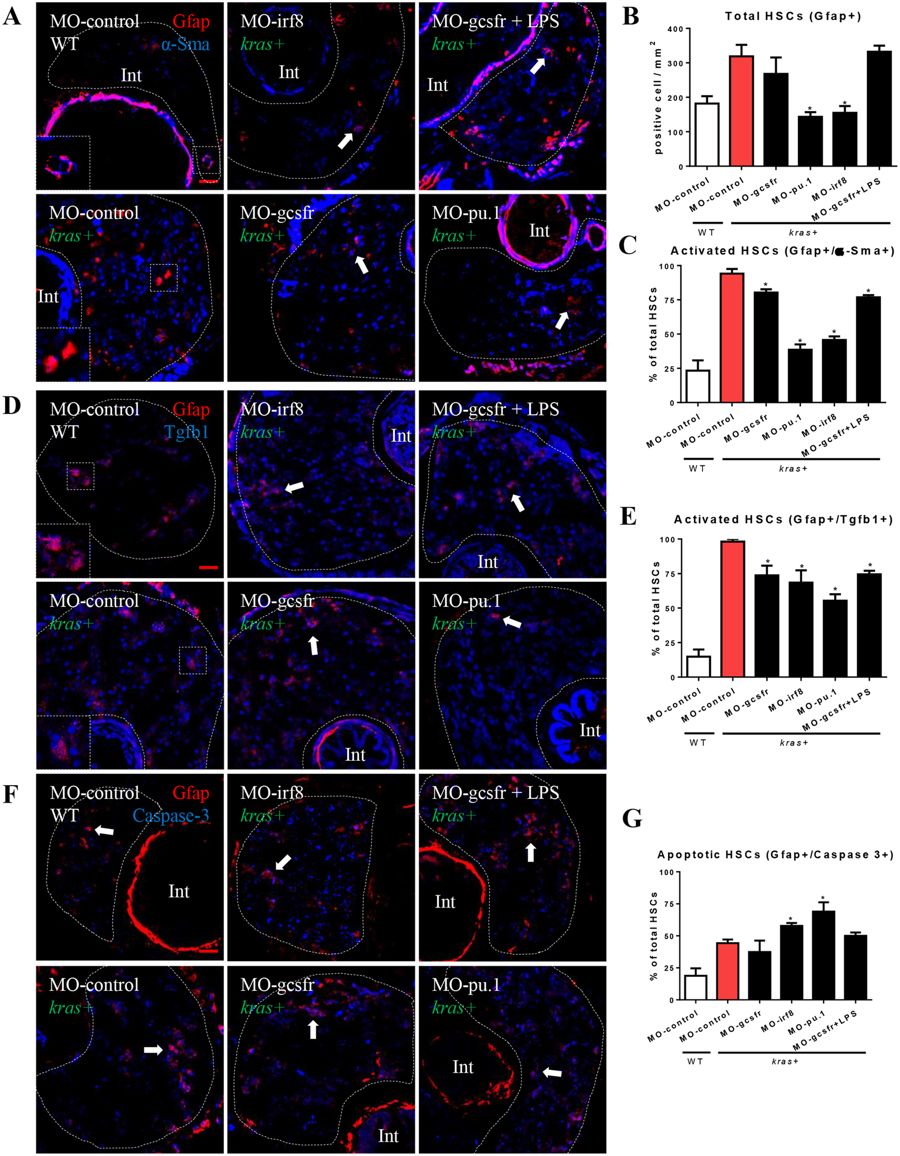
Effects of manipulation of neutrophils and macrophages on HSC density and activation. Wildtype and kras+ embryos at one-cell stage were injected with various morpholinos for manipulation of neutrophil and macrophage numbers, and treated with 20 μg/ml dox (or together with LPS) from 3 dpf to 6 dpf. Total HSC number and activated ratio were measured by IF co-staining of Gfap and α-Sma in liver sections. (A) IF co-staining of Gfap (red) and a-Sma (blue). (B) Quantification of total HSC number (Gfap+ cells). (C) Quantification of ratio of activated HSC by counting percentage of α-Sma+ cells in the Gfap+ cell population. (D) IF co-staining of Gfap (red) and Tgfb1 (blue). (E) Quantification of ratio of Tgfb1+ HSCs. (F) IF co-staining of Gfap (red) and Caspase-3 (blue). (G) Quantification of ratio of Caspase-3+ apoptotic HSCs. Livers are outlined by dash lines. Arrows indicate examples of co-staining and Int indicates intestine. Insets in (A) and (D) are enlarged view of representative staining signals in the liver. In all experiments, n = 20 for each group. *P < 0.05, compare to the group in red. Error bars represent biological replicates. Scale bars: 20 μm.