
|
Fig. S10
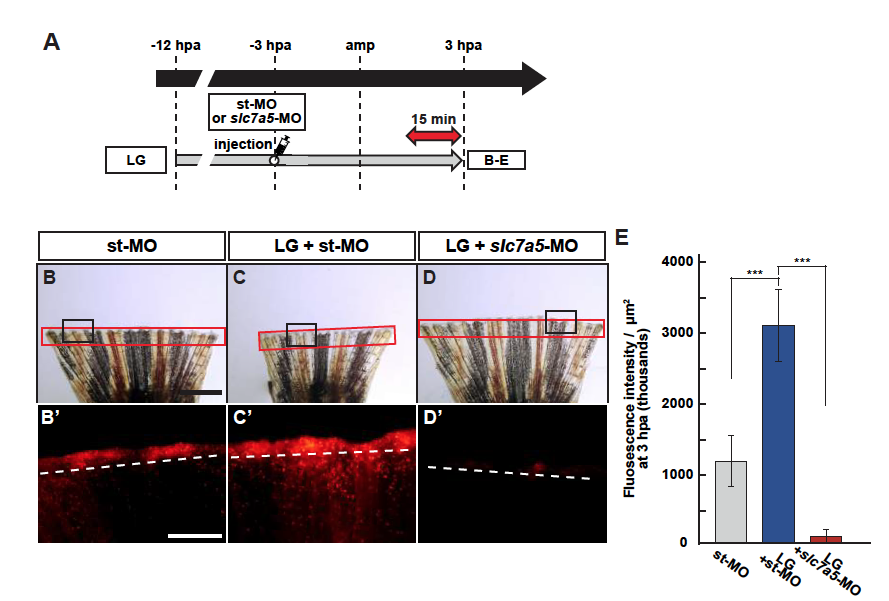
Upregulation of lysosome acidification by LG treatment is blocked by Slc7a5 knockdown.
(A) Experimental scheme of LG treatment from -12 to 3 hpa. A red two-headed-arrow indicates LysoTracker treatment, which was applied 15 min before observation. A syringe indicates vivo-MO injection at -3 hpa. (B-D’) Images of bright-field and fluorescence microscopy, and quantification of LysoTracker fluorescence intensities in st-MO-, LG-treated and st-MO-injected (LG + st-MO), or LG-treated and slc7a5-MO-injected (LG + slc7a5-MO) fin stumps at 3 hpa (n = 6). Black boxed areas in B-D are enlarged in B’-D’, respectively. The LysoTracker fluorescence intensities in red boxed areas were measured (B-D’). Representative images (B’-D’) used for quantification are shown in E. Scale bars: 1 mm (B-D) and 500µm (B’-D’). ***p < 0.001. Error bars represent the standard error.