
|
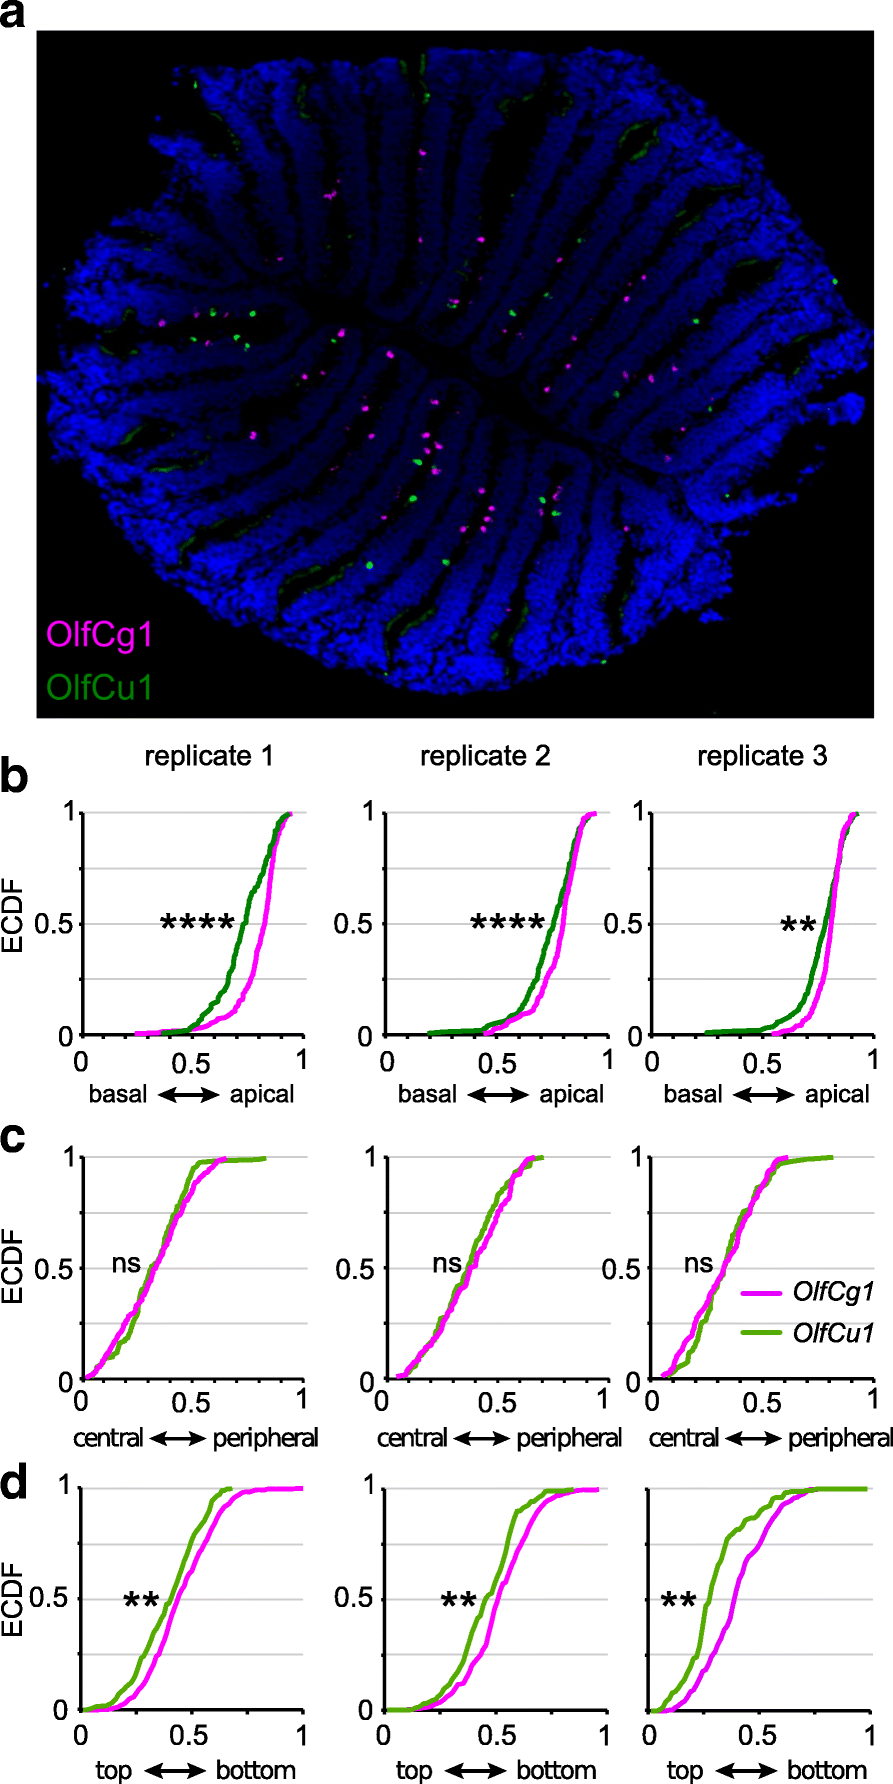
Fig. 6
Simultaneous labeling of two OlfC genes confirms distinctly different distributions. a Representative micrograph of two-color in situ hybridization, depicting sparse expression of OlfCg1 (in magenta) and OlfCu1 (in green), within a single horizontal section of the olfactory epithelium. b-d Quantitative assessment of the distributions of the labeled cells for laminar height (b), radial distance (c) and along the vertical z-axis (d). The resulting distributions of relative laminar height (from 0, most basal to 1, most apical, i.e. bordering to the lumen), relative radius (from 0, innermost to 1, outermost) and relative height within the organ (from 0, top section to 1, bottommost section) are shown unbinned as empirical cumulative distribution function (ECDF). Color of ECDF graphs corresponds to the color employed in panel a. KS-test with a p-value cutoff of < 0.01 was used to evaluate the significance of differences between the distributions, if any. Significance is indicated by asterisks, **, p ≤ 0.01; ****, p ≤ 0.0001