
|
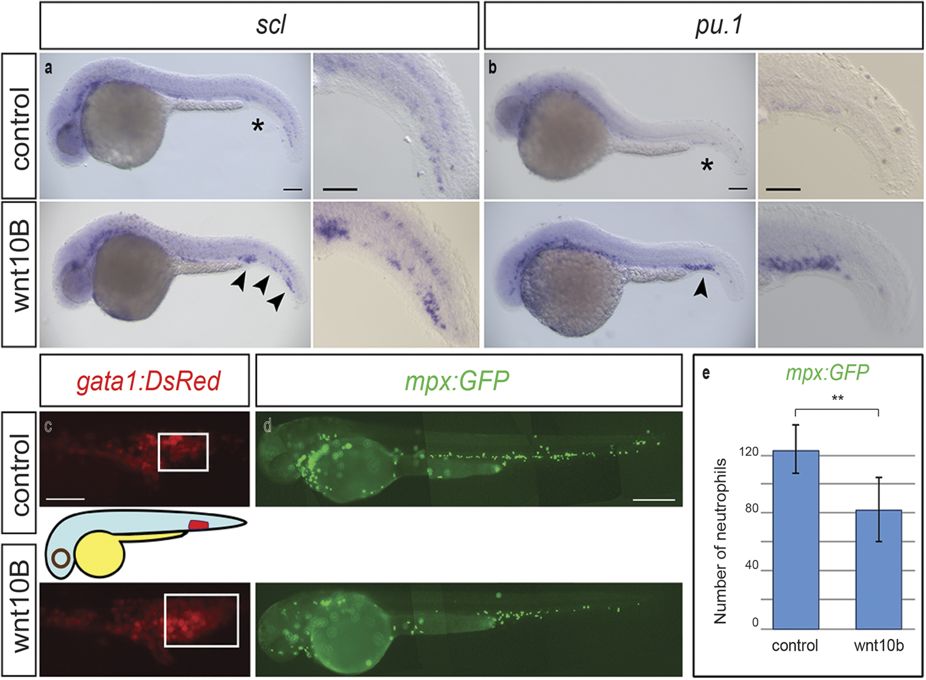
Fig. 1
(a,b) Representative whole mount in-situ hybridizations to scl (a) and pu.1 (b) on 28 hours post fertilization (hpf) embryos. Increased number of cells expressing the two genes in the PBI of wnt10b-injected embryos (arrowheads; scl, n = 62; pu.1, n = 114) in comparison to controls (asterisks; scl, n = 34; pu.1, n = 66). Scale bar, 100 μm. Magnification scale bar, 50 μm. (c) Forced wnt10b upregulation in 28 hpf gata1:DsRed transgenic embryos, expressing the red fluorescent protein DsRed in erythroid progenitors, caused the increase in the number of gata1-positive cells in the PBI in 30% of the injected embryos (wnt10b-injected embryos n = 58 and controls n = 41). Scale bar, 125 μm. (d) Representative wnt10b-injected and control 48 hpf mpx:GFP transgenic embryos characterized by GFP expression in differentiated neutrophils. Scale bar, 300 μm. (e) wnt10b overexpression in 48 hpf mpx:GFP transgenic embryos caused a marked reduction in the number of GFP-positive circulating cells in 52% of the injected embryos (wnt10b-injected embryos, n = 18; control embryos, n = 10, mean ± s.d.). **<0.01 with Student’s t-test.