
|
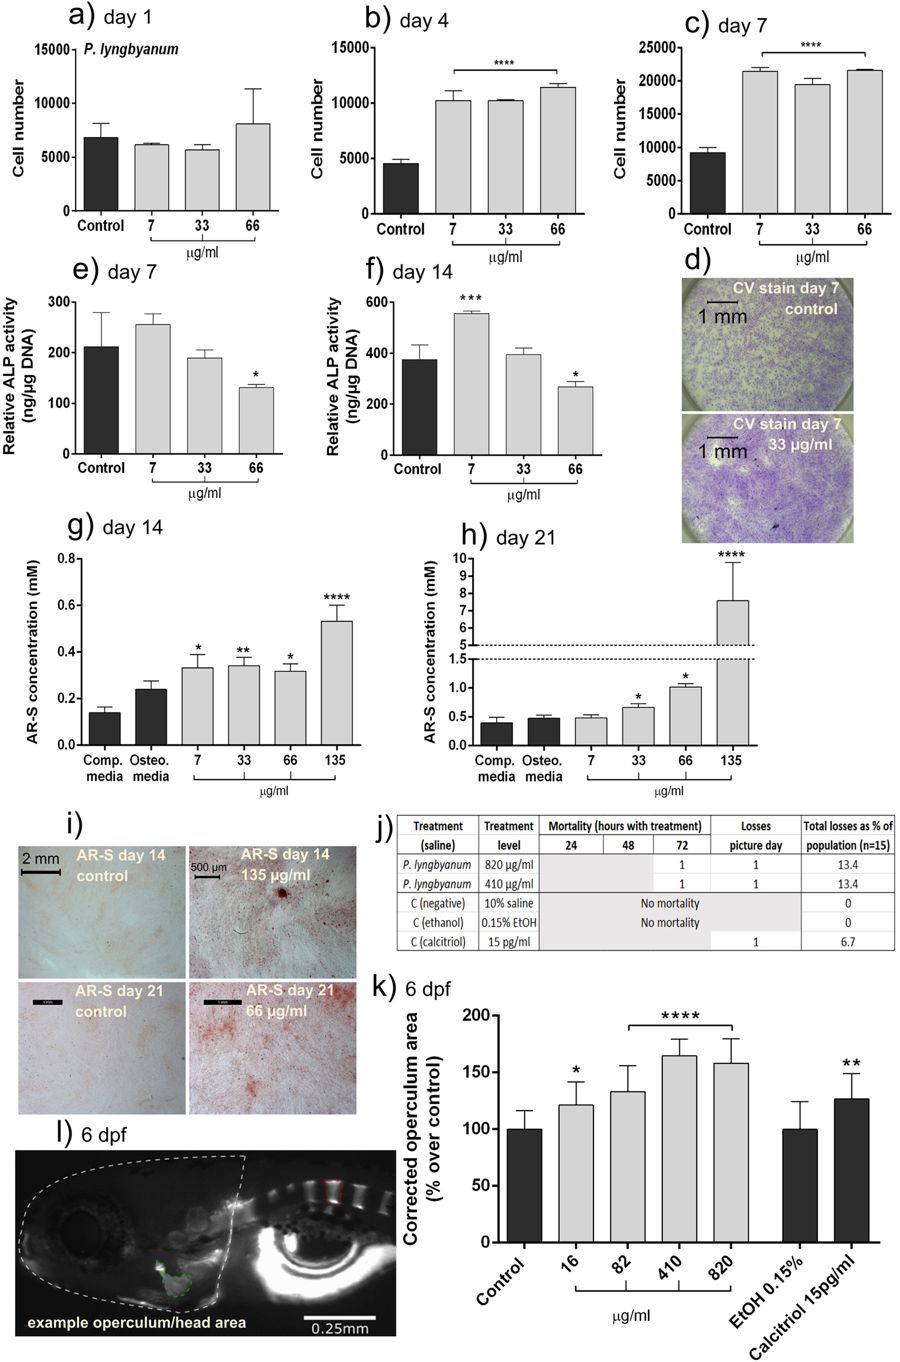
Fig. 1
Osteogenic potential of P. lyngbyanum. (a–c) Proliferation of hBMSCs at day 1 (a), 4 (b) and 7 (c) using crystal violet assay. Cell number is presented as mean +/− SD, (n = 3). (d) micrographs of hBMSC cell monolayers treated for 7 days with control saline solution or 33 µg/ml of P. lyngbyanum extract and then stained with crystal violet (CV). (e,f) ALP activity of hBMSCs at day 7 (e) and day 14 (f) normalized to DNA concentration. Relative ALP activity is presented as mean +/− SD (n = 4). (g,h) In vitro mineralisation of hBMSCs at day 14 (g) and 21 (h). AR-S concentration is presented as mean +/− SD (n = 4). (i) Micrographs of hBMSC monolayers stained with AR-S, for control and 135 µg/ml of P. lyngbyanum extracts at day 14 and 66 µg/ml at day 21. (j) Mortality rates of larvae during in vivo experiments. (k) Operculum area changes with P. lyngbyanum treatments. Control was system water with 10% saline solution. A 0.15% EtOH control corresponded to the positive calcitriol control. Corrected operculum area (i.e. operculum area normalised to head area) is presented as mean +/− SD (n = 15). (l) Picture of an AR-S stained zebrafish larvae at 6 dpf showing head and operculum area evaluated through morphometric analysis. Statistical significance: * p ≤ 0.05, ** p ≤ 0.01, *** p ≤ 0.001, **** p ≤ 0.0001 between the stated treatment and control.