
Fig. 5
- ID
- ZDB-IMAGE-180730-34
- Publication
- Juan et al., 2018 - Myosin1D is an evolutionarily conserved regulator of animal left-right asymmetry
- All Figures
- Figures for Juan et al., 2018
|
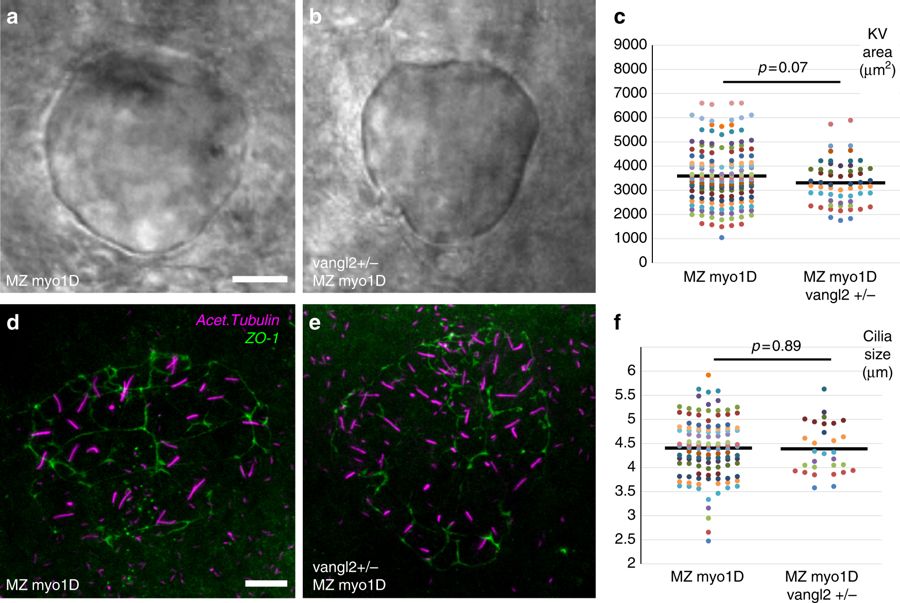
Fig. 5
KV area and cilia size are similar in MZ myo1D and MZ myo1D vangl2+/−. a–c MZ myo1D (n = 156) and MZ myo1D ; vangl2+/− (n = 60) animals have similar KV sizes. d–e Projection of images from confocal stacks used to quantify the length of cilia (acetylated tubulin, magenta) in the KV (ZO-1 positive cells, green) of MZ myo1D mutants (d), or MZ myo1D ; vangl2+/− embryos (e). f MZ myo1D (n = 117 embryos/4939 cilia) and MZ myo1D ; vangl2+/− (n = 30/1653) embryos present a similar cilia size. The MZ myo1D mutant dataset displayed in f is the same that is also displayed in Fig. 3j. a, b, d, e are dorsal views of eight-somites stage KVs, anterior up. Scale bars: 20 µm in a, b; 10 µm in d, e