
Fig. 3
- ID
- ZDB-IMAGE-180730-32
- Publication
- Juan et al., 2018 - Myosin1D is an evolutionarily conserved regulator of animal left-right asymmetry
- All Figures
- Figures for Juan et al., 2018
|
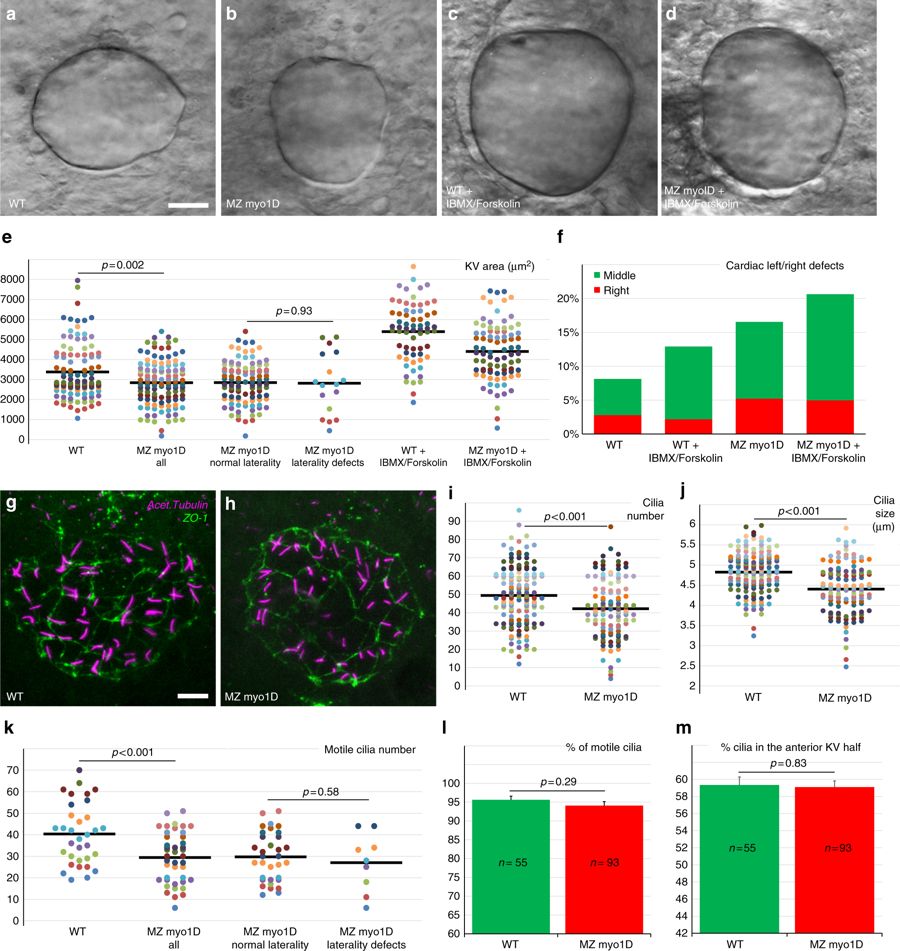
Fig. 3
myo1D controls the morphogenesis of the zebrafish left–right Organizer. a–e Compared to WT (n = 104), MZ myo1D mutants (n = 118) present a reduced KV size. Treatment with IBMX and Forskolin promotes KV lumen inflation and increases organ size in WT (n = 66) and MZ myo1D mutants (n = 85). e Dot plots of KV equatorial surface area in individual embryos. KV size is similar in embryos with normal or defective laterality. f IBMX/Forskolin treatment restores KV size (d, e), but not laterality in MZ myo1D mutants. g–j Cilia number and size are reduced in MZ myo1D mutants. g, h Projection of images from confocal stacks used to quantify number and length of cilia (acetylated tubulin, magenta) in the KV (ZO-1 positive cells, green). i, j Number and average length of cilia in individual embryos are reduced in MZ myo1D (n = 117 embryos/4939 cilia) compared to WT (n = 141/6967). k–m Confocal imaging of Arl13b-GFP labeled cilia in living embryos was used to analyze the number (k), motility (l) and positioning (m) of KV cilia. k Dot plot representing motile cilia number in individual embryos. MZ myo1D (n = 42) mutants display lower motile cilia numbers compared to WT (n = 33). Motile cilia numbers are however similar in MZ myo1D mutant embryos with normal or defective laterality. Total cilia numbers for this experiment are displayed in Supplementary Fig. 5. l myo1D loss of function does not impair ciliary motility. m WT and MZ myo1D mutant animals display a similar enrichment of cilia in the anterior KV half. a–d, g, h are dorsal views of the KV, anterior up. All data collected at the eight-somites stage. Horizontal bars in e, i, j, k represent mean values. Error bars in l, m represent SEM. Scale bars: 20 µm in a–d; 10 µm in g–h