
|
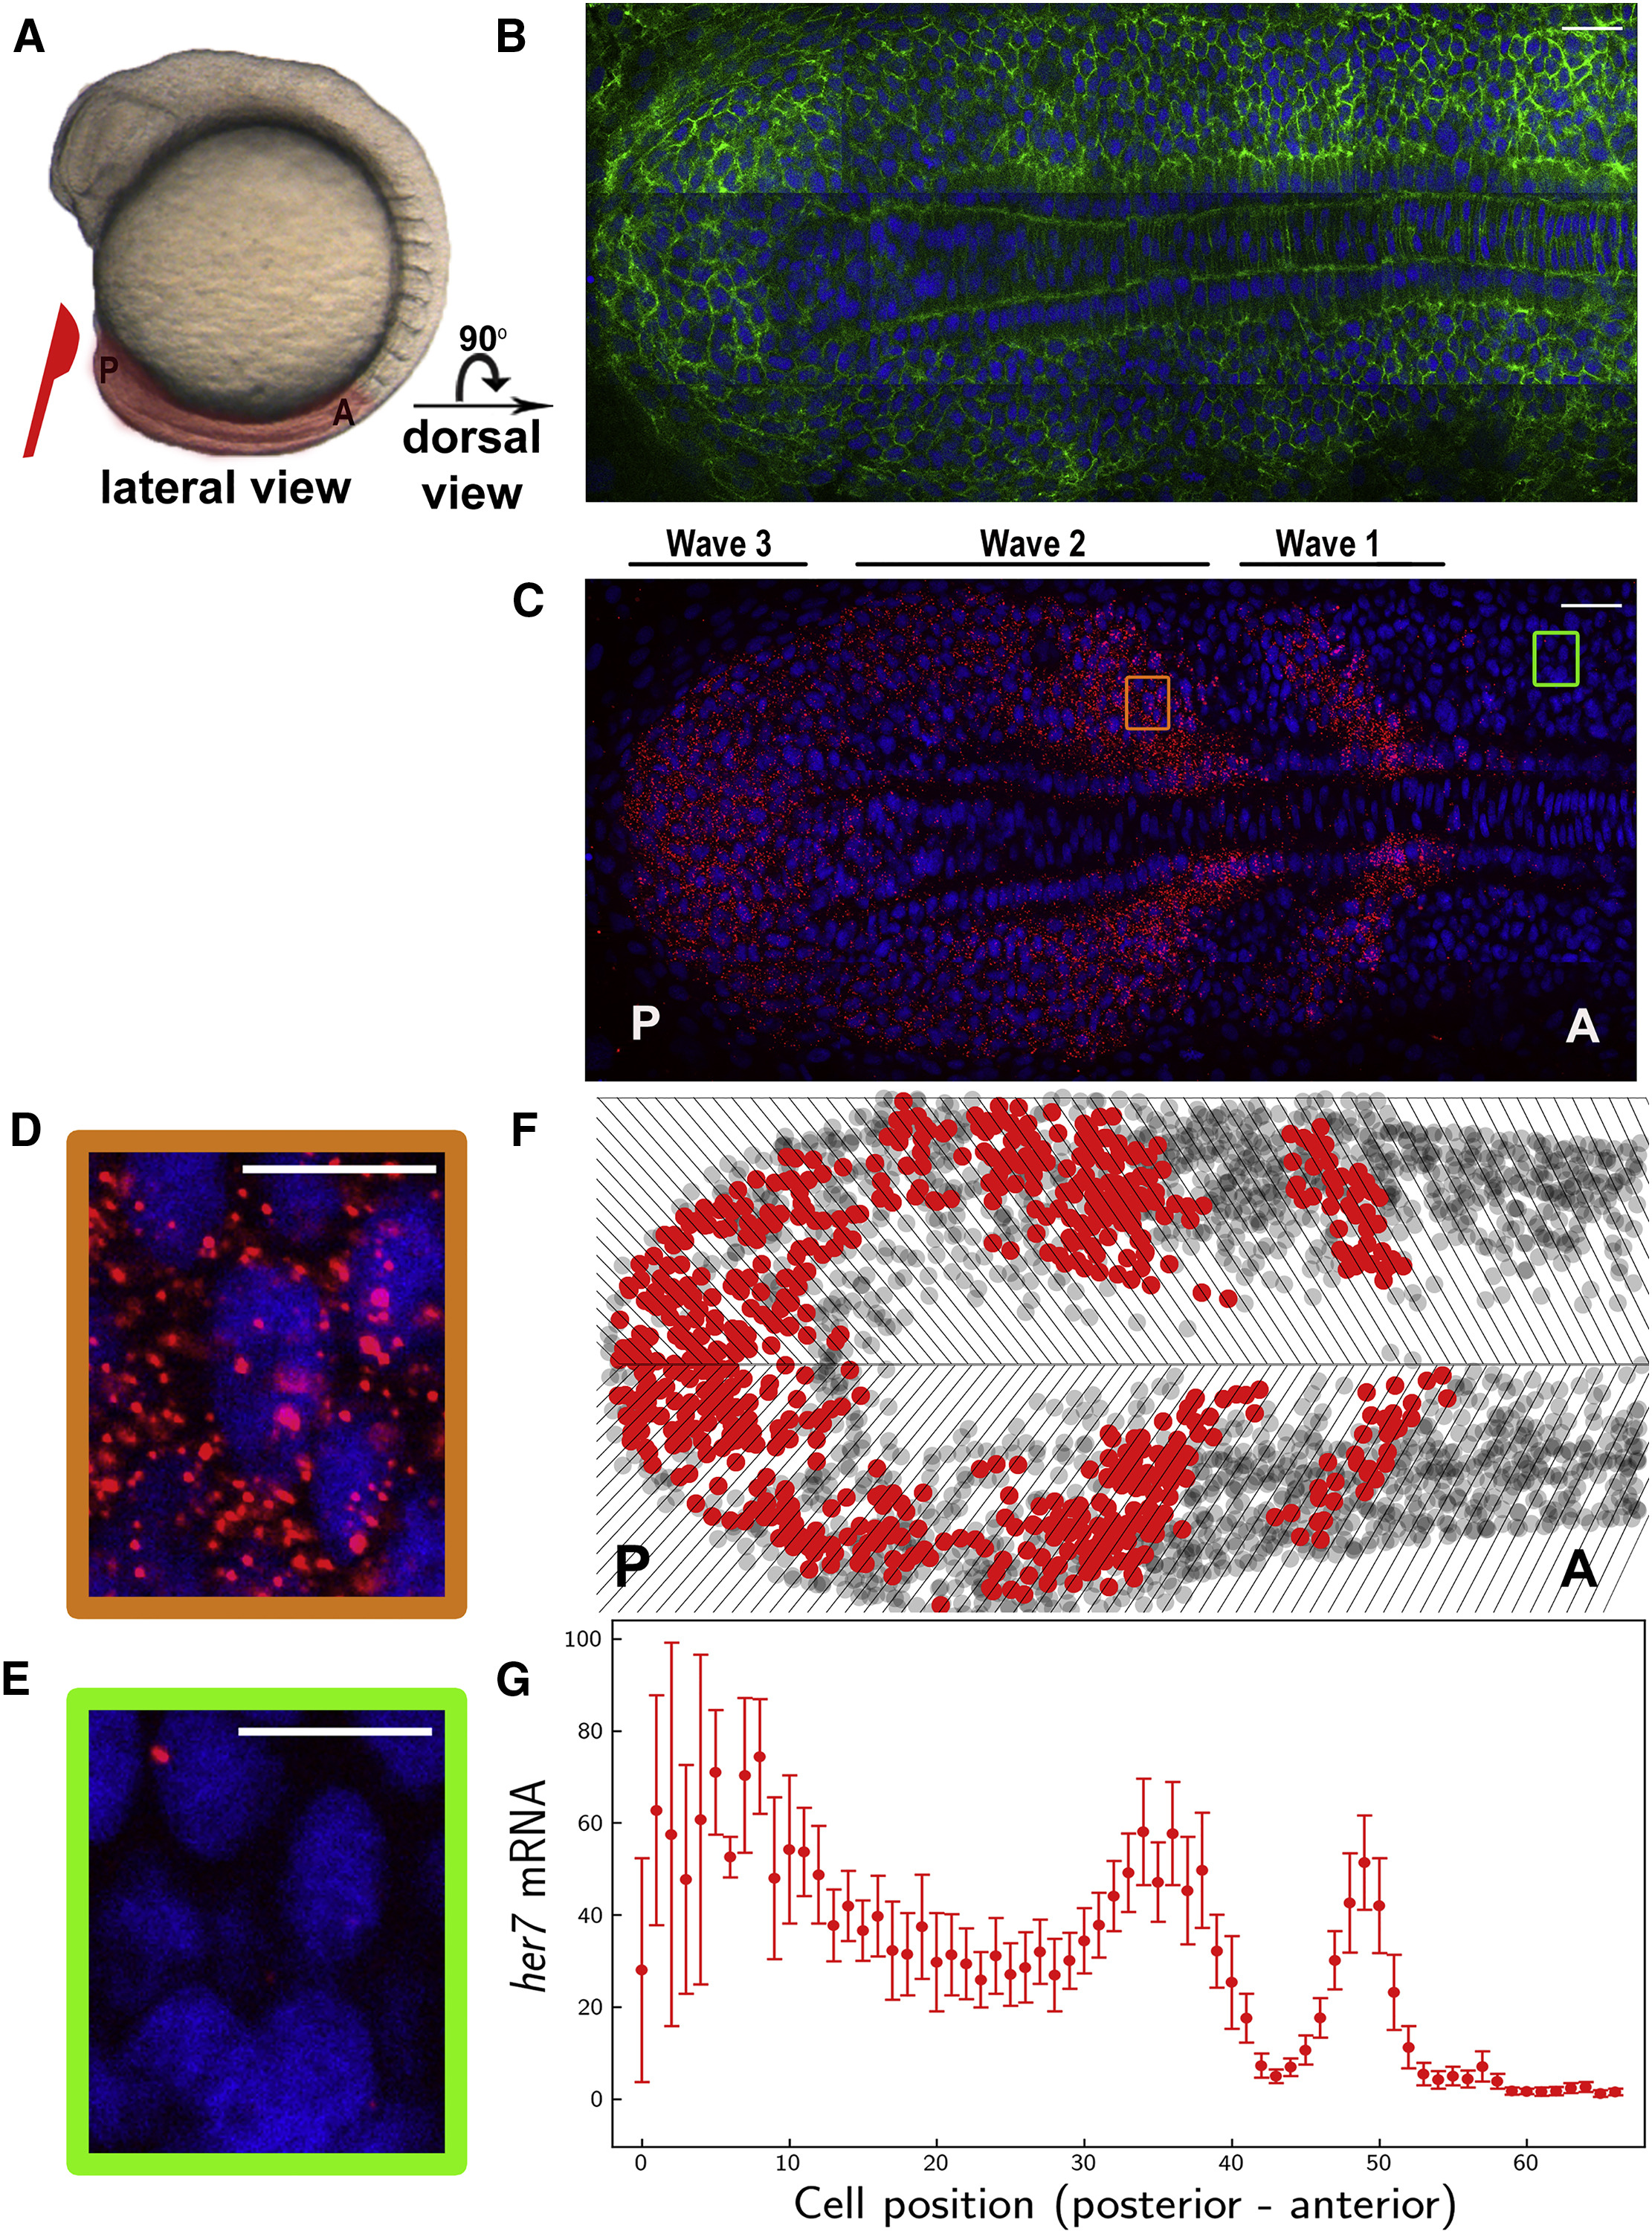
Fig. 1
Single RNA Molecules Are Counted in Single-Phase-Binned Cells in the Intact Zebrafish Presomitic Mesoderm
(A) A wild-type zebrafish embryo at the 10-somite stage. PSM, highlighted in pink, is dissected from the embryo. Posterior (P) is to the left, and anterior (A) is to the right.
(B and C) A single z-section of a smFISH picture in a flat-mounted PSM from a wild-type embryo. Cell membrane (green in B), her7 mRNA (red in C) and nuclear staining (blue in B and C). PSM images are rotated 90 degree compared to that in (A).
(D and E) The images are zoomed on a high-expression stripe (orange square) (D) or a low-expression stripe (green square) (E).
(F) Tissue is divided in single-cell-wide disks along the axis corresponding to different oscillation phases. Cells containing RNA higher or lower than an arbitrary threshold are plotted as red or gray circles, respectively. Top is left half of PSM, and bottom is right half of PSM.
(G) RNA levels from left half of PSM are plotted along the posterior-to-anterior direction. Each dot corresponds to the average RNA number in a spatial phase-binned cell population; error bars indicate 2 SEs.
Scale bars mark 30 and 10 μm in (B) and (C) and in (D) and (E), respectively. See also Figure S1 and Table S1.