
|
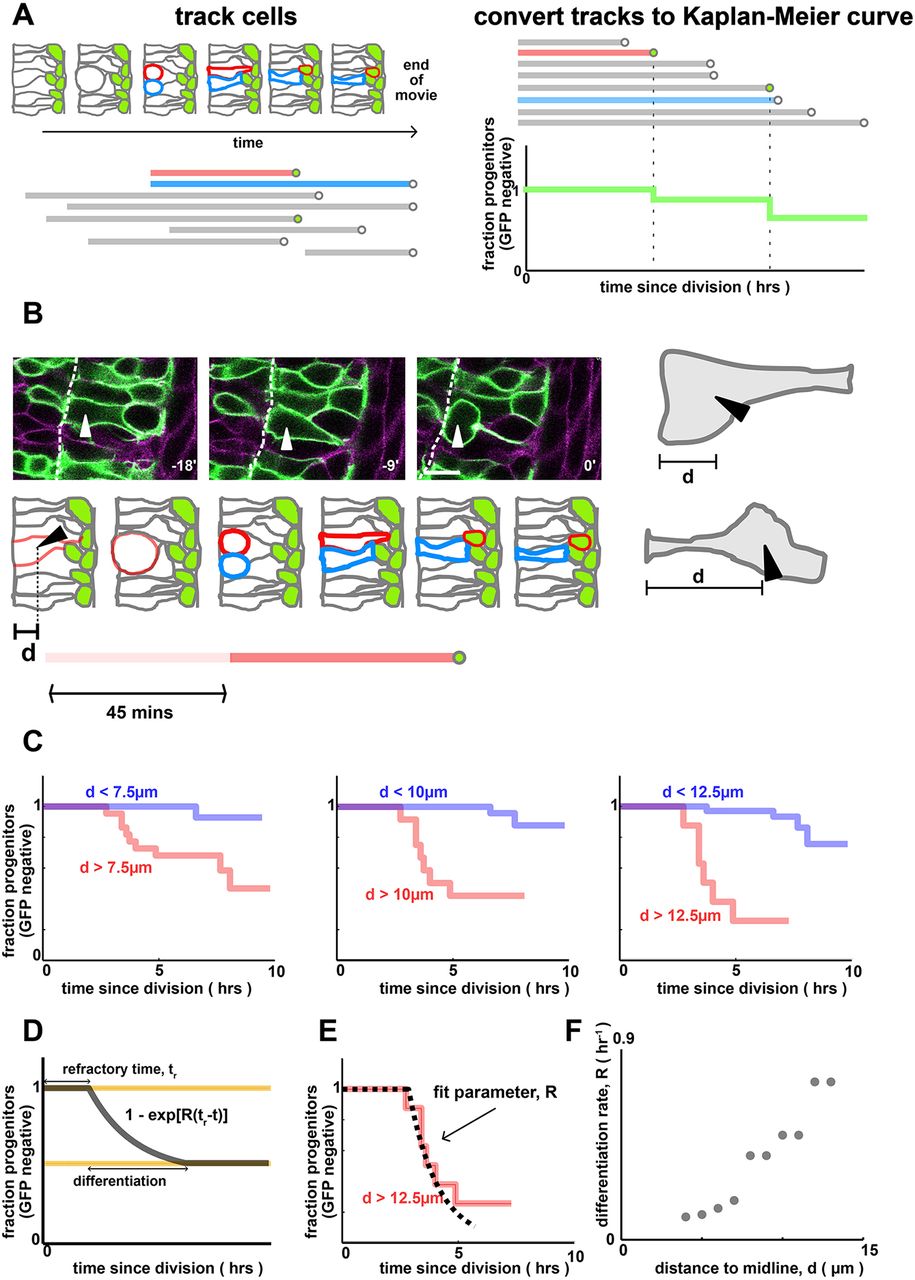
Fig. 2
Progenitors that are far from the apical surface differentiate more frequently. (A) Quantifying cell-tracking data using Kaplan–Meier curves. Cells are manually tracked over time (schematic, upper left). Tracks begin at mitosis and end when (i) the cell turns on GFP (i.e. differentiates, see the red cell track), (ii) divides or (iii) becomes untrackable/moves out of frame (see the blue cell track). This generates an ensemble of tracks (lower left). To calculate the Kaplan–Meier curves, we align all tracks to begin at the same time, order them by length and, for each timepoint, compute the probability that progenitors remain GFP negative (right). (B) Quantification of pre-mitotic cell shape by distance to midline, d. Scale bar: 10 µm. Arrowhead shows a cell entering mitosis. Dashed line indicates the apical surface. (C) Single-cell tracking reveals that cells that are far from the apical surface pre-division turn on neurod more rapidly than those that are close. The dependence of differentiation rate on cell shape is independent of the threshold value that defines which cells are ‘far’ and which cells are ‘close’. P=0.01 (left), P=1e-6 (middle) and P=1e-7 (right). Data are from n=46 cells and n=3 embryos. The number of cells closer/further than each distance threshold is: 24/22 (7.5 µm), 34/12 (10 µm) and 38/8 (12.5 µm). (D) A simple model for differentiation, where for some time windows each cell differentiates at a constant rate per unit time, R (the differentiation rate). (E) Numerical fit of the model in D to the data in C to infer the differentiation rate parameter R. The dotted line refers to the best fit model. (F) Differentiation rate parameter, R, as a function of the distance to midline, d.