
Fig. S10
- ID
- ZDB-IMAGE-180724-34
- Publication
- Schredelseker et al., 2018 - Bsx controls pineal complex development
- All Figures
- Figures for Schredelseker et al., 2018
|
Fig. S10
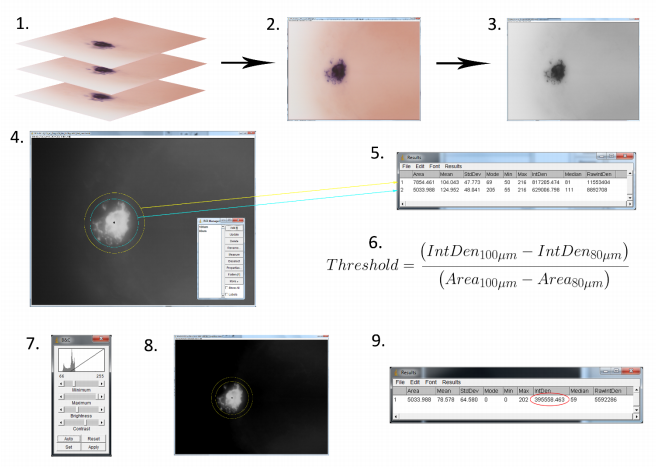
Quantification of whole-mount in situ hybridization staining.
In order to evaluate stain intensity and stain area as measure for mRNA expression region and level, we quantified the WISH stains by integrating the grey values of images over the area of the pineal complex and subtracting background stain intensities. (1.) Image stacks were acquired on AxioPlan (Zeiss) widefield transmitted light microscope using low DIC contrast settings and 1 µm z-planes. (2.) Minimum intensity projections of 25 z-planes encompassing the pineal gland were generated. (3.) The z-projection image was converted to 8-bit grey-scale. (4.) The grey-scale image was inverted. Next, a circle with 80 µm diameter was drawn encompassing the pineal gland, and a second circle with 100 µm diameter was drawn surrounding the smaller circle. (5.) Using ImageJ, the Integrated Density (IntDen) was determined for both circles. (6.) Pixel value threshold for background subtraction was calculated. (7.) Image histogram clipping was performed using the background threshold as a lower limit. (8.) Integrated density of inner circle was determined from adapted picture. (9.) Integrated density of pineal gland after background subtraction was used as quantification of stain and used for statistical analysis.