
|
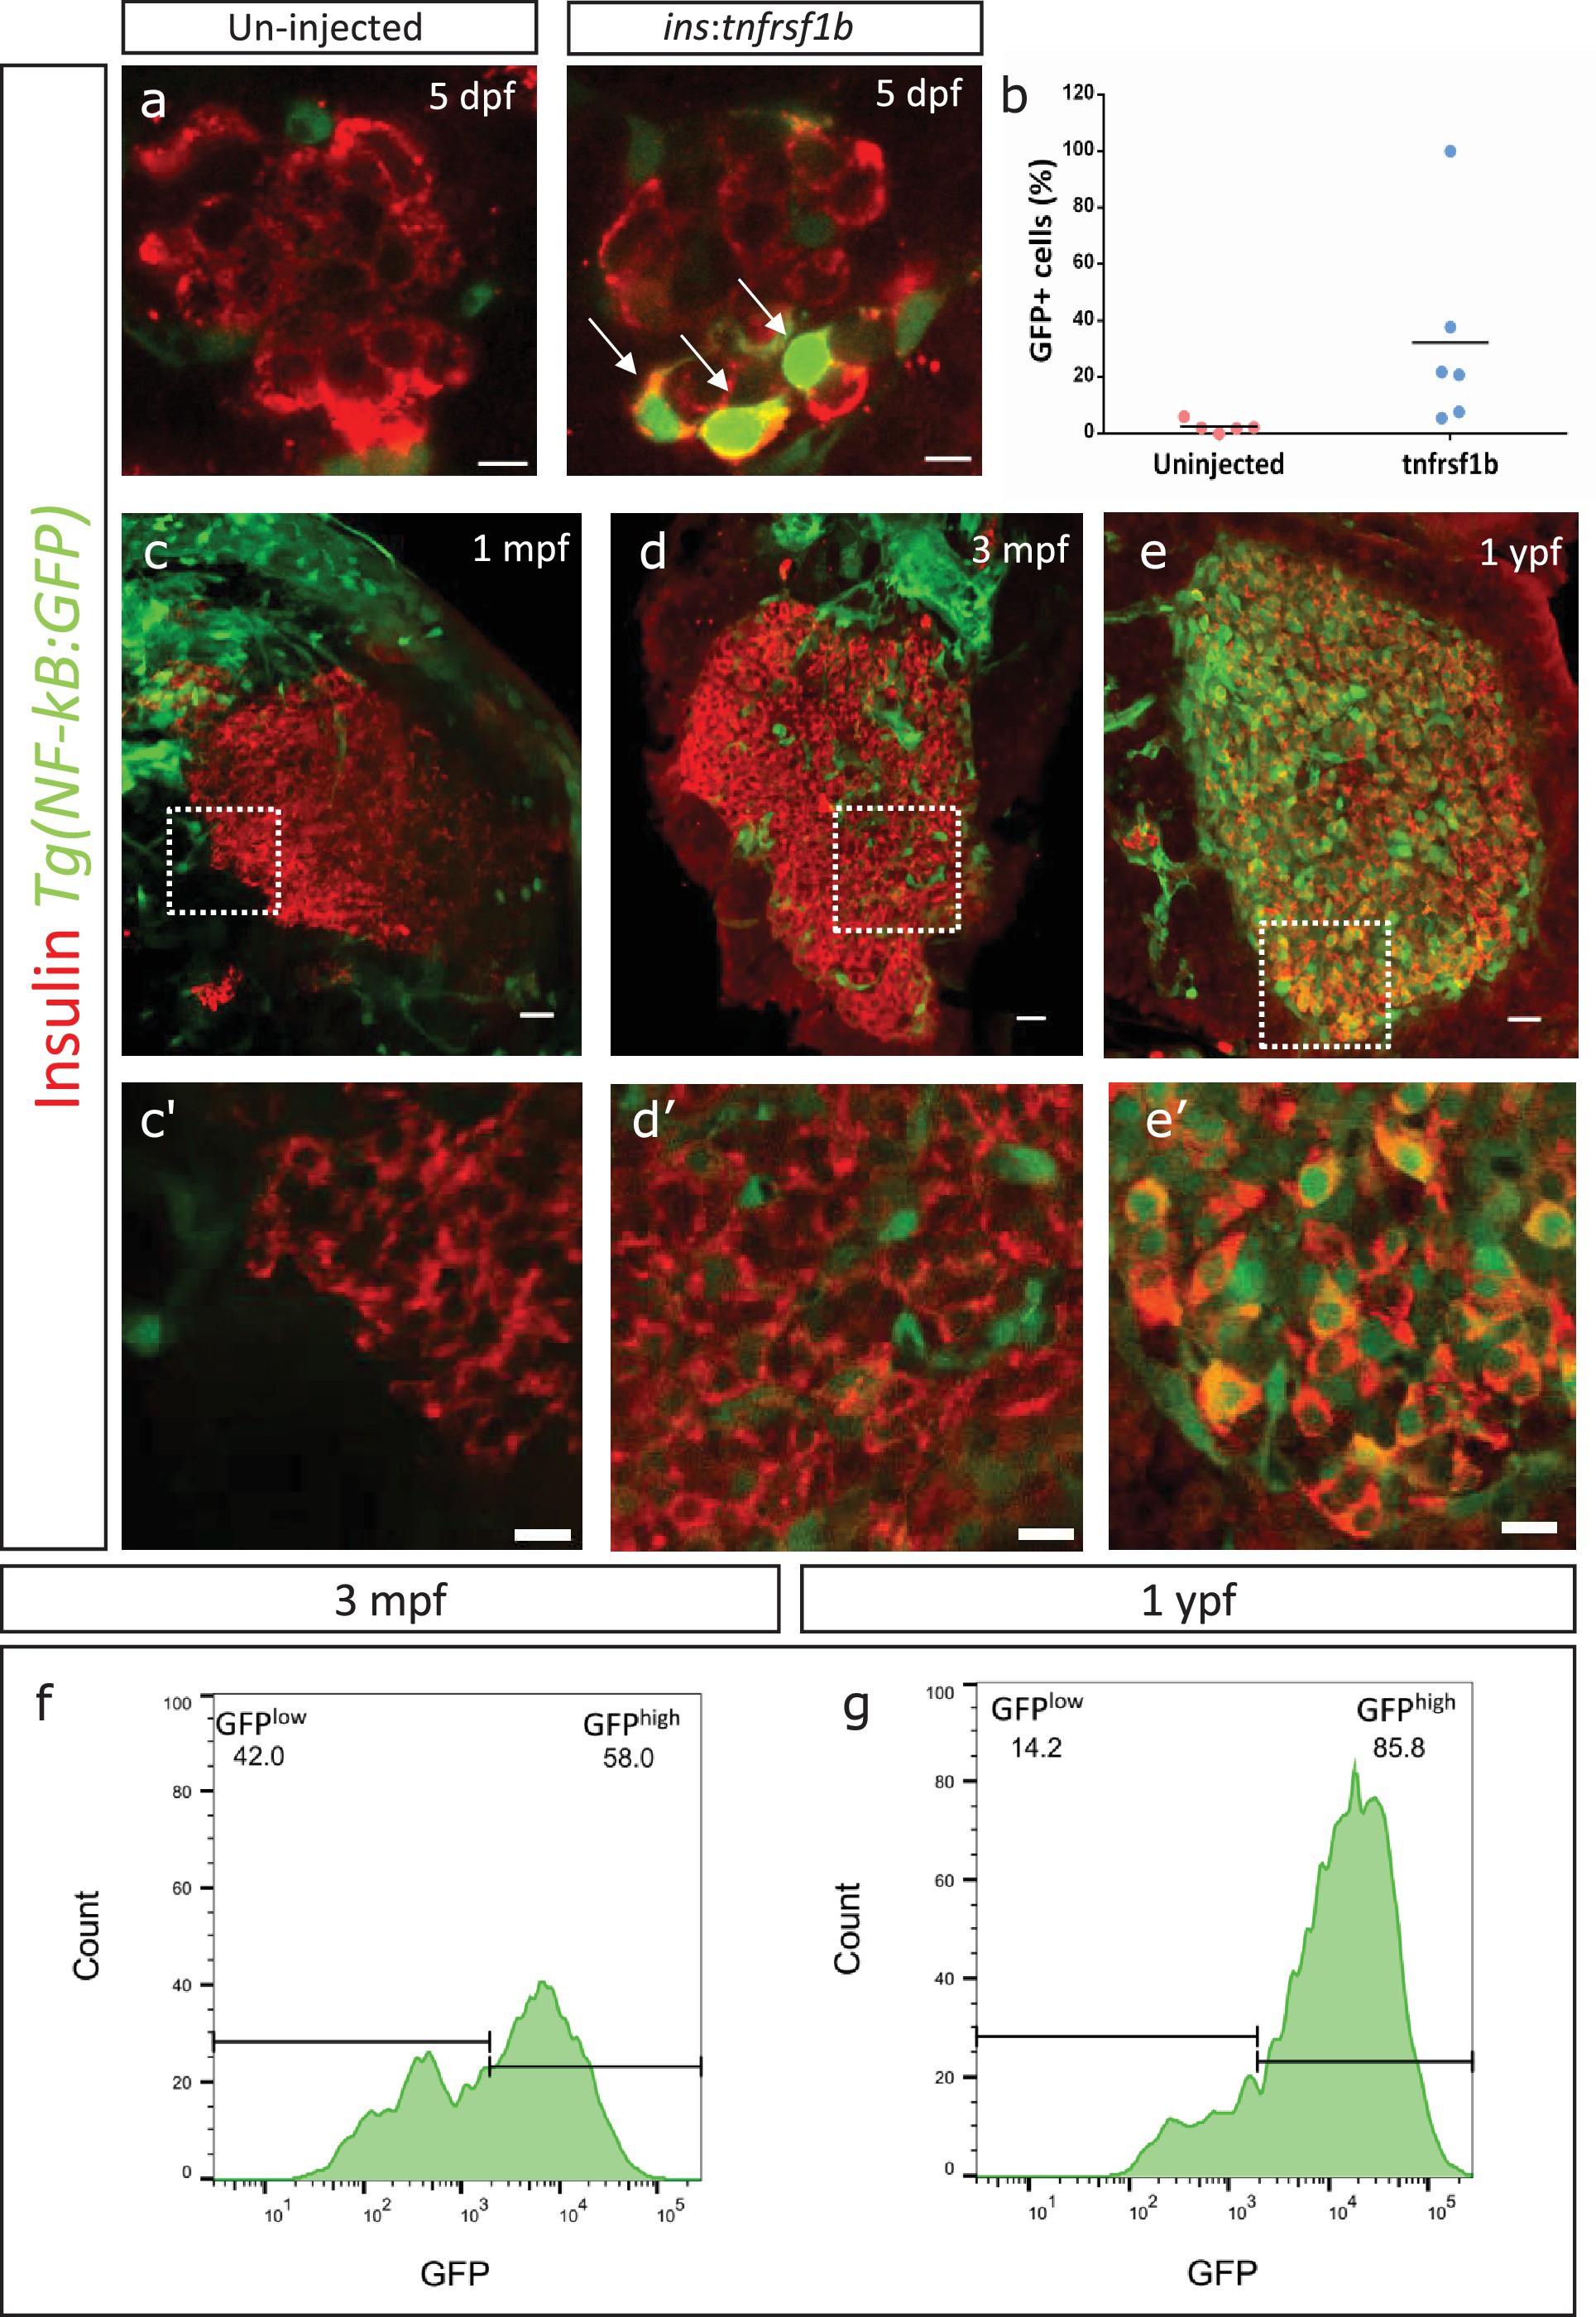
Fig. 3
An inflammation reporter reveals heterogeneous activation of NF-kB signaling in beta-cells with age.
(a) The images show single confocal planes from islets of 5 dpf larvae. The tnfrsf1b coding sequence was expressed under the control of the insulin promoter. The plasmid was injected in Tg(NF-kB:GFP) embryos at the one-cell-stage, leading to mosaic and stochastic expression of the construct in beta-cells. The Tg(NF-kB:GFP) reporter expresses GFP (green) under the control of six tandem repeats of NF-kB DNA-binding sites. Beta-cells were labelled using an insulin antibody (red). Arrows indicate GFP-positive beta-cells. Scale bar 5 µm. (b) The graph shows the percentage of GFP-positive and insulin-positive cells in uninjected controls (n = 5) and tnfrsf1b injected animals (n = 6) at 5 dpf. Horizontal bars represent mean values. (c–e) Confocal stack of islets from Tg(NF-kB:GFP) animals at 1 mpf, 3 mpf and 1 ypf. Beta-cells were labeled using an insulin antibody (red). NF-kB:GFP reporter expression is shown in green. Scale bars 20 µm. (c’–e’) Insets show high magnification single planes of the confocal stacks (corresponding to the regions shown using white dotted-lines in the top panels). Scale bar 10 µm. (f–g) Beta-cells from 3 mpf Tg(NF-kB:GFP) animals were labeled with TSQ (Zn2+ labeling dye) and analyzed using FACS. The graph shows GFP intensity (along the X-axis) and the distribution of beta-cells at 3 mpf and 1 ypf. Horizontal lines indicate the division point between GFPlow and GFPhigh levels. Percentage values represent proportion of cells with GFPlow or GFPhigh expression.