
|
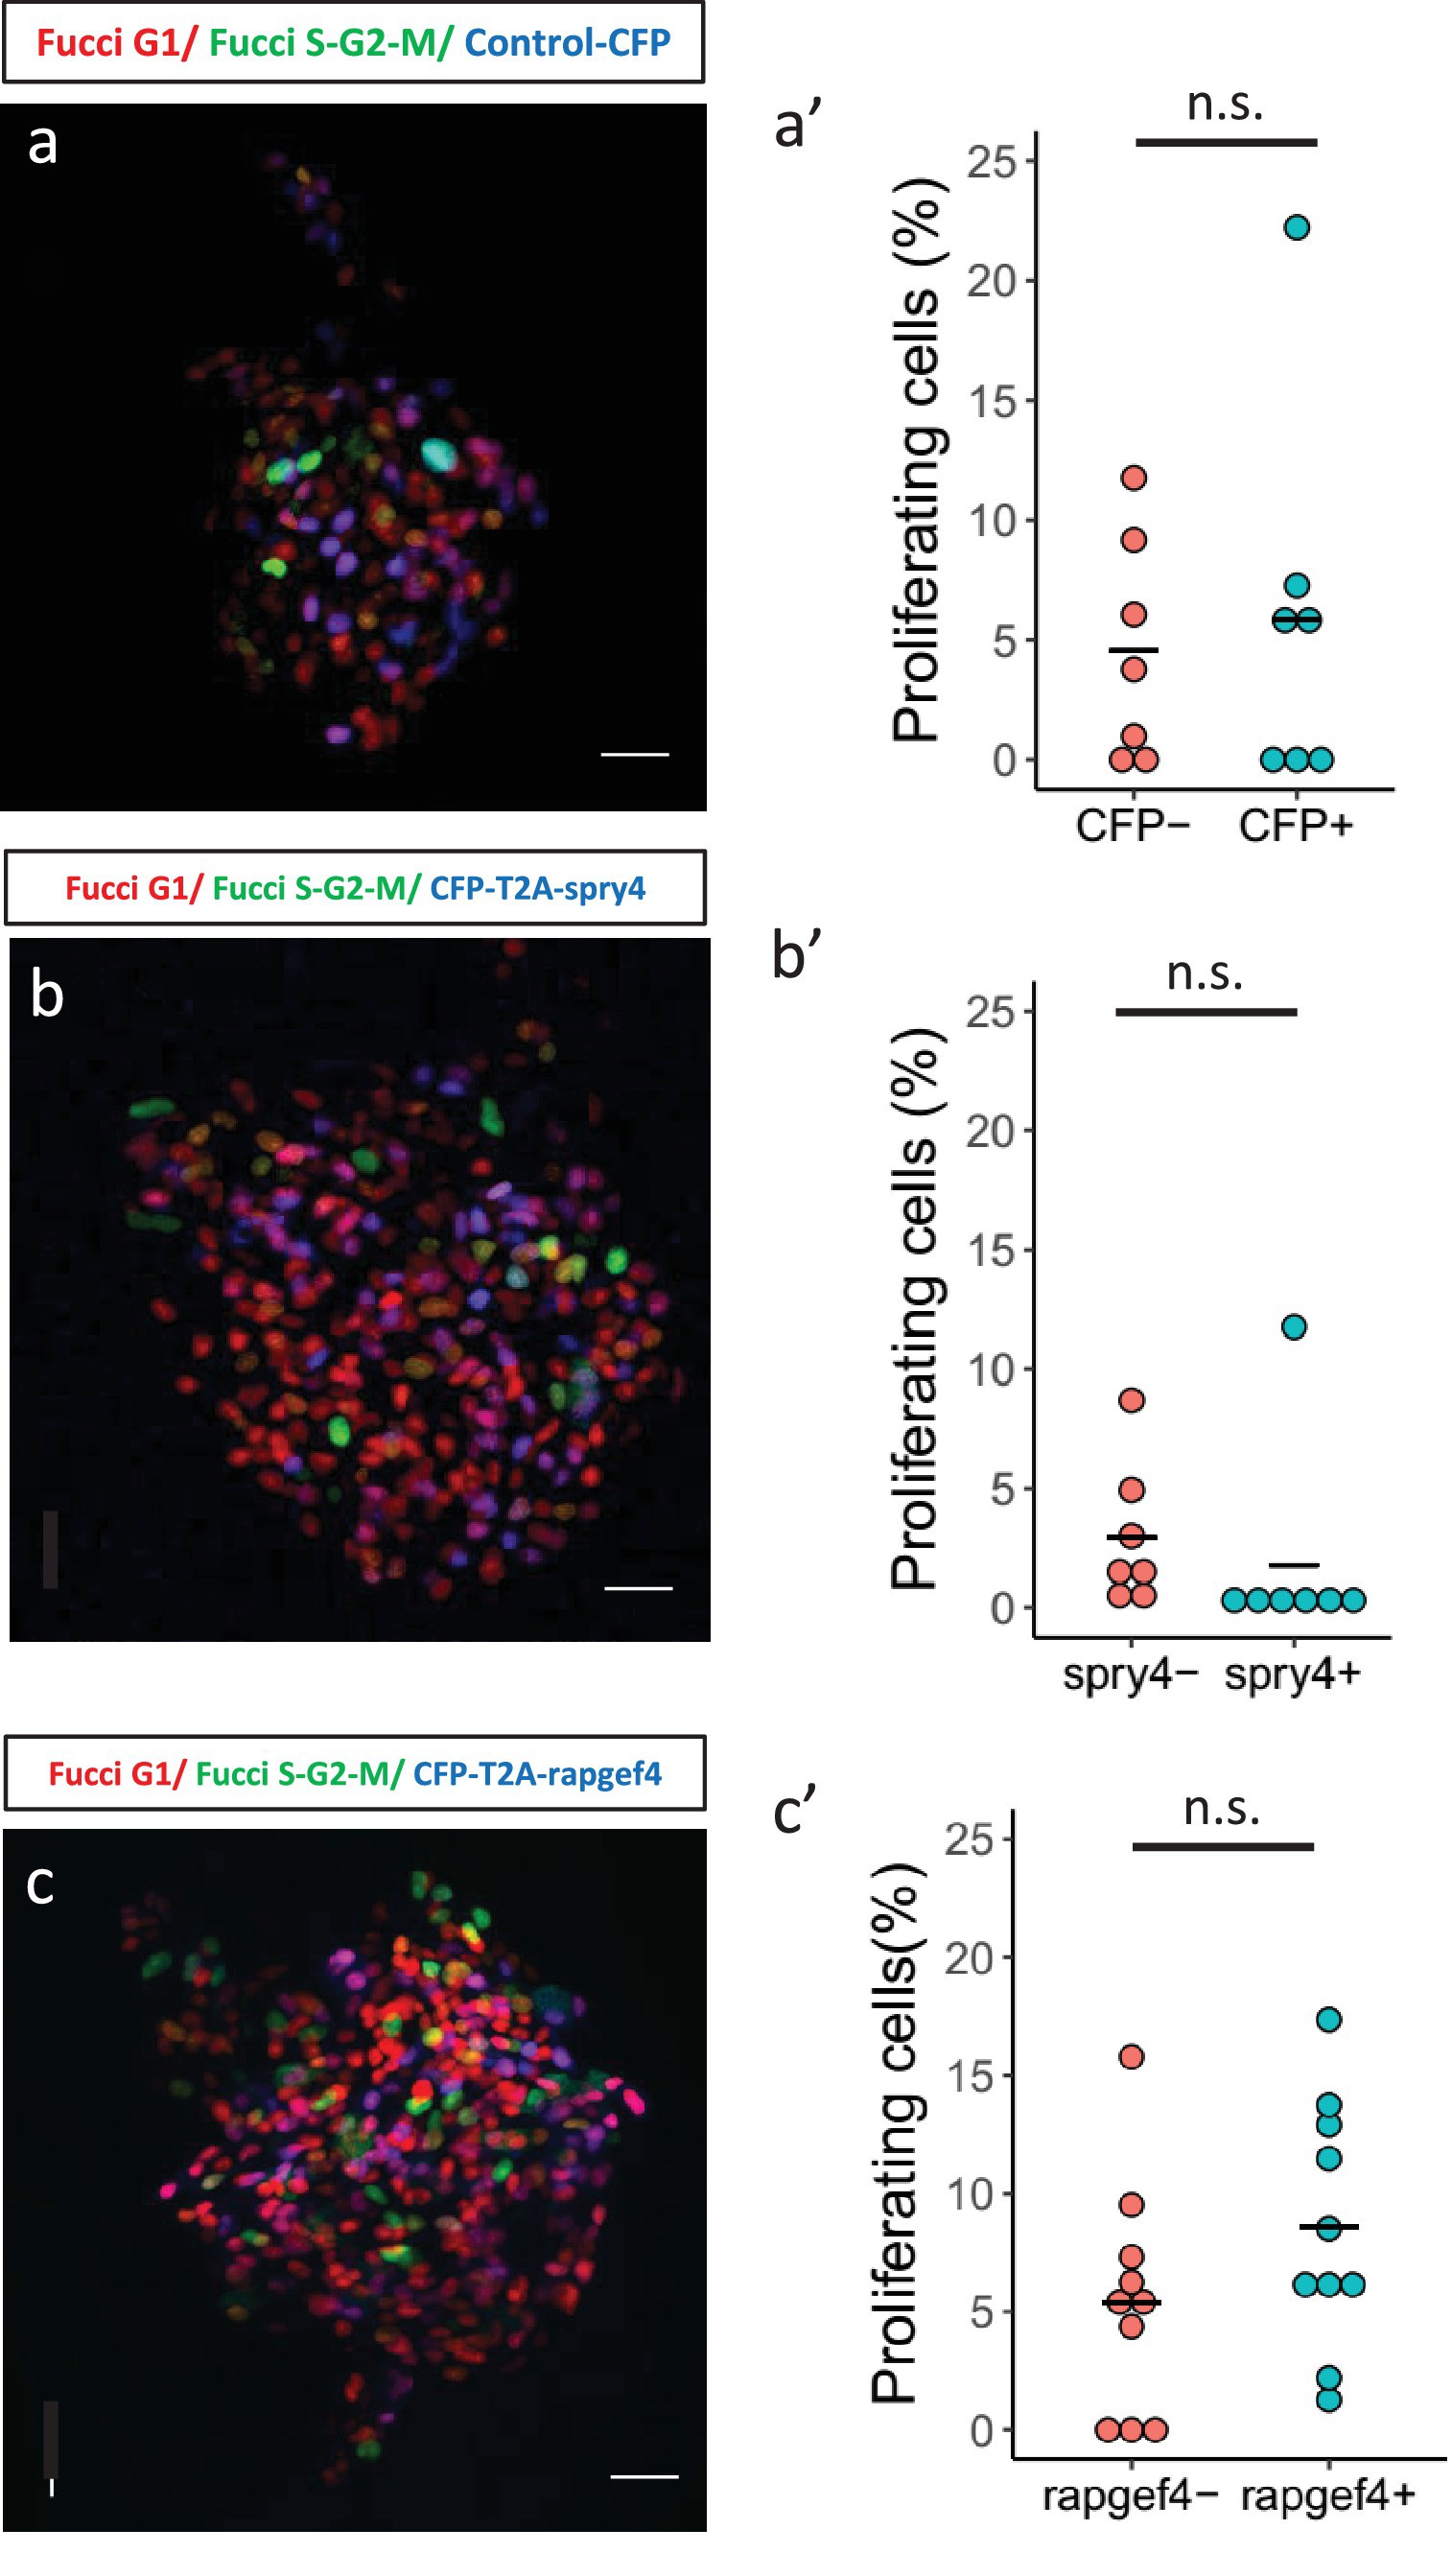
Fig. 6-S2
Mosaic expression of candidate genes in beta-cells to study their effect on proliferation.
(a,b,c) Confocal images showing mosaic expression of nuclear-CFP (a), CFP-T2A-spry4 (b) and CFP-T2A-rapgef4 (c) at 23 dpf. Tg(ins:Fucci-G1) expression is shown in red, Tg(ins:Fucci-S/G2/M) expression in green and CFP expression in blue. Anterior to the top. Scale bar 20 µm. (a’,b’,c’) Quantification of the percentage of Tg(ins:FUCCI-S/G2/M)-positive and Tg(ins:FUCCI-G1)-negative (green only) beta-cells among the CFP-positive and CFP-negative sub-populations for each experiment shown in the left-hand panels. Horizontal bars represent mean values (two-tailed t-test, p>0.05).