
Fig. 6
- ID
- ZDB-IMAGE-180723-17
- Genes
- Publication
- Fassier et al., 2018 - Motor axon navigation relies on Fidgetin-like 1-driven microtubule plus end dynamics
- All Figures
- Figures for Fassier et al., 2018
|
Fig. 6
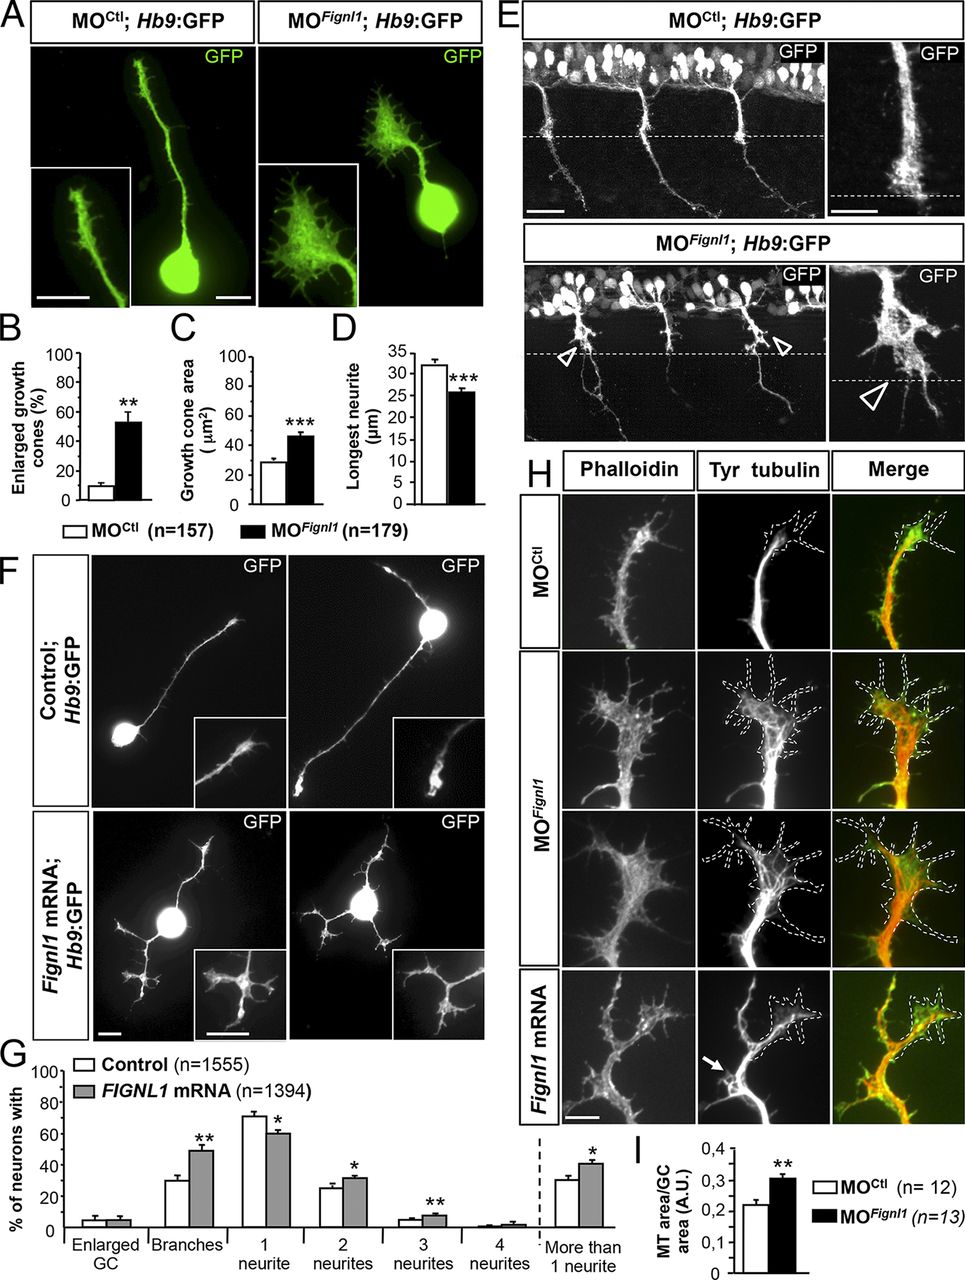
Fignl1 modulates SMN morphology via MT remodeling. (A) SMN primary cultures from 24-hpf MOCtl or MOFignl1 Tg(Hb9:GFP) embryos labeled at 9 hpp with a GFP antibody. (B) Percentage of enlarged GCs. (C) Mean GC area. (D) Mean length of the longest neurite. (B–D) 179 MOCtl and 157 MOFignl1 SMNs were analyzed in three independent experiments. (E) Immunostaining of 26-hpf MOCtl and MOFignl1 Tg(Hb9:GFP) embryos using a GFP antibody. Lateral views of the trunk; anterior is to the left. Right images are higher magnifications of spinal motor CGs on facing left images. Open arrowheads indicate enlarged GCs. Dashed lines outline the horizontal myoseptum. (F) SMN primary culture from 24-hpf control and Fignl1 mRNA–injected Tg(Hb9:GFP) embryos labeled 9 hpp with GFP antibody. (A and F) Insets show higher magnifications of GCs. (G) Percentage of SMNs with enlarged GCs, collateral branches, and one, two, three, or more neurites. Quantifications were performed on 1,300 control and Fignl1-injected SMN in four independent experiments. (H) Immunodetection of MTs (red) and F-actin (green) in cultured control, Fignl1-depleted, or Fignl1-overexpressing Tg(Hb9:GFP) SMNs at 9 hpp. Dashed lines outline the GC surface. Bars, 10 µm. (I) GC area occupied by MTs. Quantifications on at least 13 MOCtl and MOFignl1 SMNs selected from three independent experiments. *, P ≤ 0.05; **, P ≤ 0.01; ***, P ≤ 0.001; unpaired two-tailed t test. Error bars are SEM.