
Image
|
Figure Caption
Fig. 3
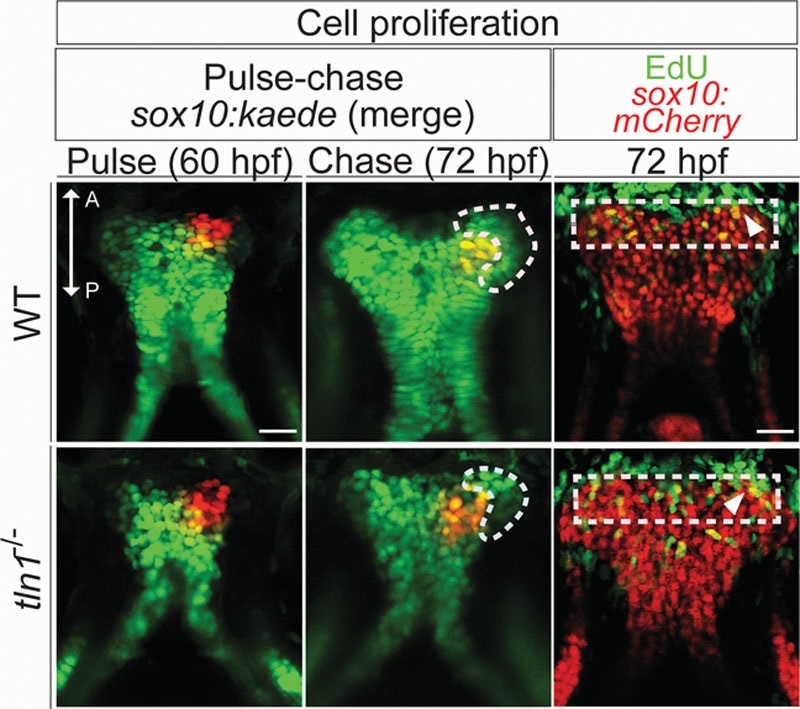
Pulse-chase assay in Tg(sox10:kaede) transgenic to investigate palatal CNCC proliferation (above). Anterior (A) is up in all images. The distal tip of the palate is photoconverted from green to red at 60 hpf (pulse), in WT (left and above) and the mutant (left and below), with the contralateral side as control. Confocal images are taken after chase, at 72 hpf in both WT and tln1 (center). The palate is imaged in the green and the red channels in all instances. Green cells added onto the distal part of the palate during the chase depict the proliferative front, marked with white dotted line (center). Reduced cell proliferation is observed in tln1 mutants, (center and below) when compared with WT (center and above). EdU staining (green) reveals a proliferative front in both the WT and tln1 palate (red), marked by a white dotted rectangle (right). The proliferative cells are in yellow (overlap of green EdU+ and mCherry sox10+ CNCCs), depicted by white arrowheads. Scale bar: 100 μm. A, anterior; P, posterior.
Figure Data
Acknowledgments
This image is the copyrighted work of the attributed author or publisher, and
ZFIN has permission only to display this image to its users.
Additional permissions should be obtained from the applicable author or publisher of the image.
Full text @ Plast Reconstr Surg Glob Open