
|
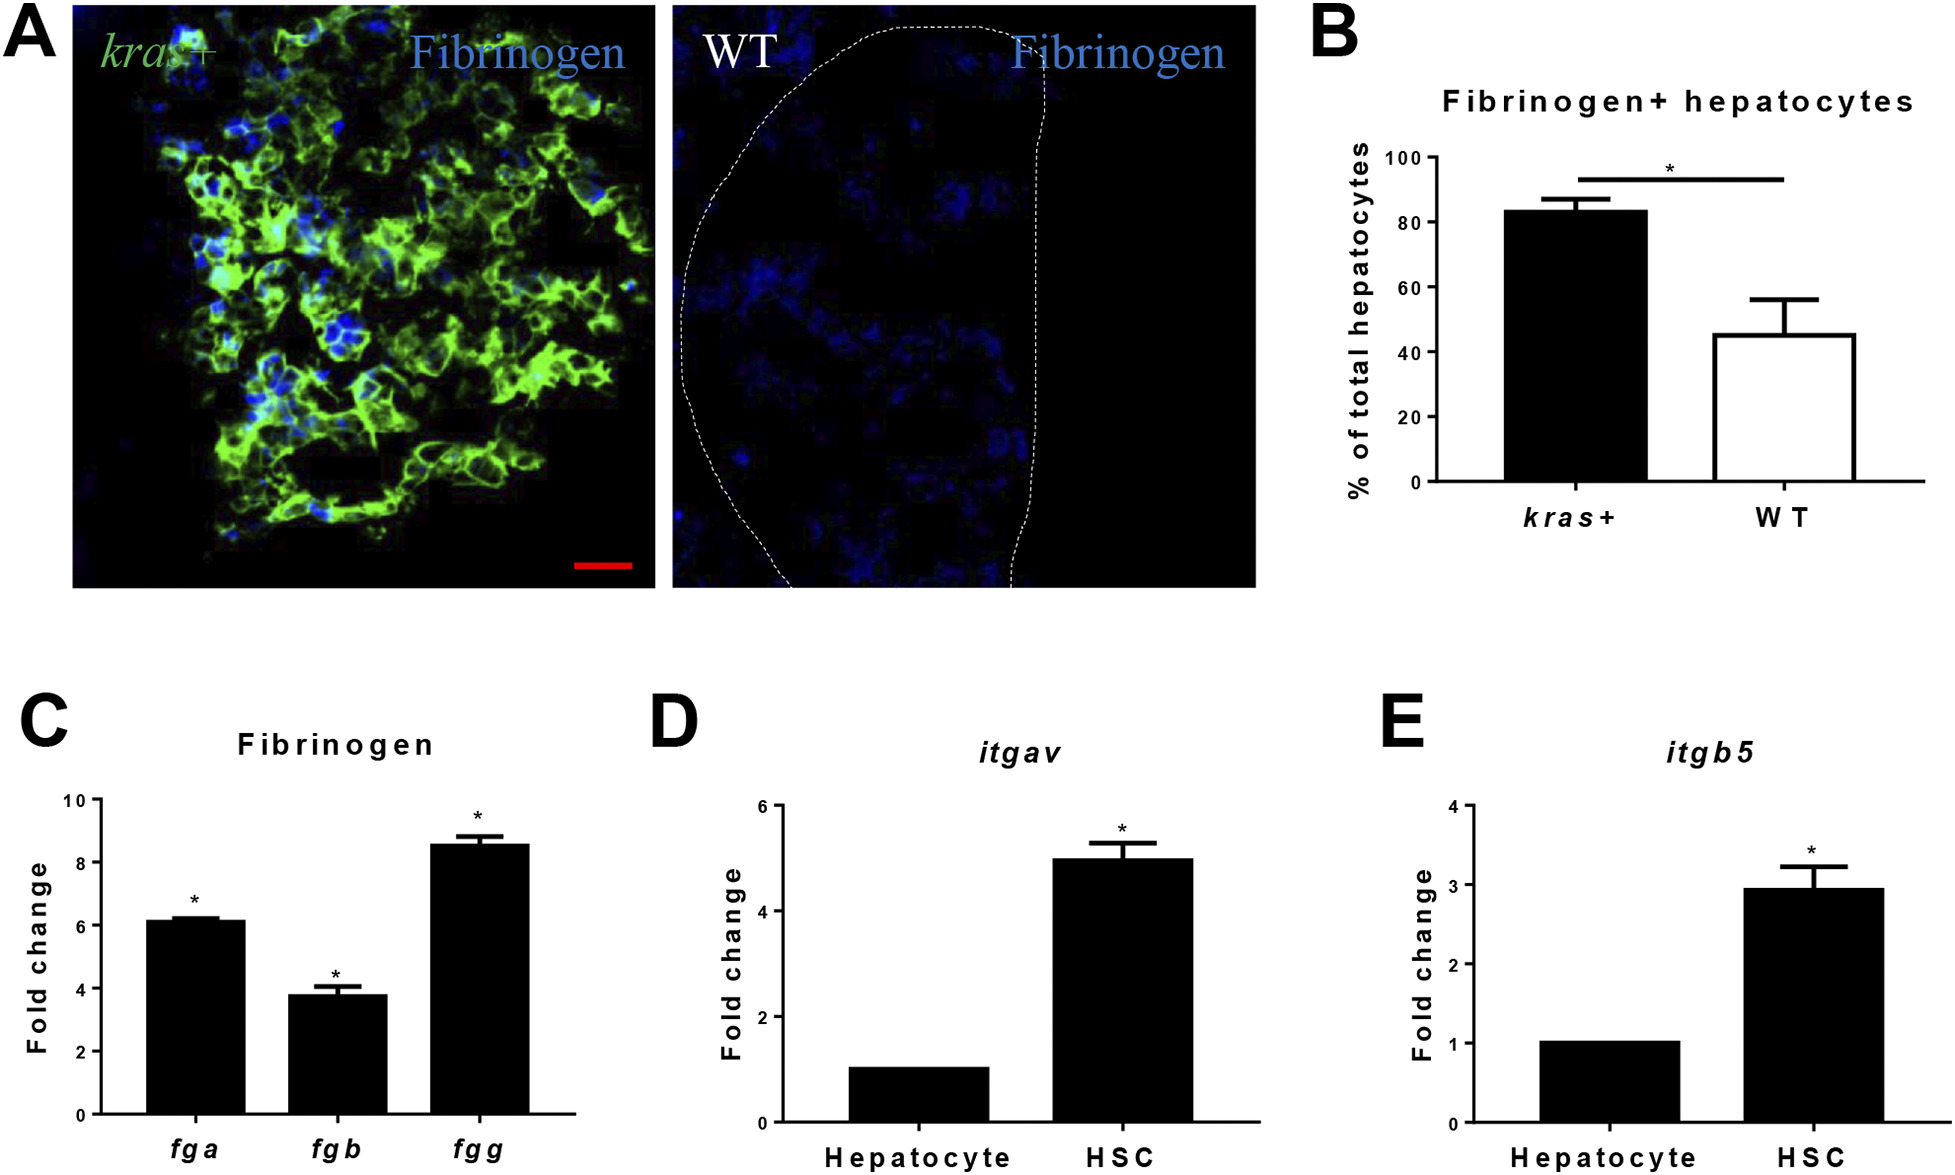
Fig. 2
Fibrinogen production and integrin αvβ5 expression in the liver. (A) IF staining of Fibrinogen on liver sections of kras+ and WT larvae. Livers in the WT picture is marked by a dash line. (B) Quantification of Fibrinogen-positive hepatocytes. (C) Fold change of expression of fibrinogen genes (fga, fgb an fgg) krasv12-expressing hepatocytes compared to WT hepatocytes. Integrin receptor, (D-E)expression of itgav (D) and itgb5 (E) mRNAs in hepatocytes and HSCs. Normal hepatocytes and HSCs were sorted by FACS based on DsRed and GFP expression from fabp10+ and hand2+ transgenic zebrafish respectively. Relative expression levels are shown with the value from hepatocytes arbitrarily set as 1. *P < .05. Scale bar: 20 μm.