
Image
|
Figure Caption
Fig. S2
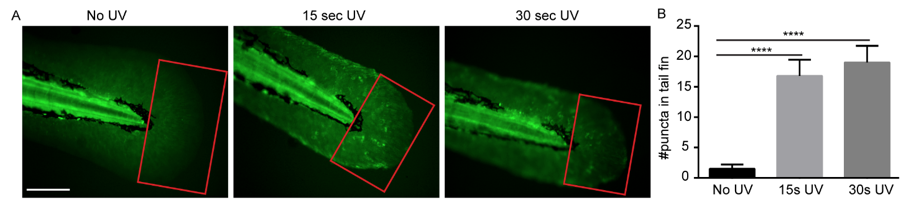
Characterization of Tg(βactin:secA5-YFP) line.
(A) Tg(βactin:secA5-YFP) larvae at 3 dpf were subjected to either no UV, 15 sec, or 30 sec irradiation. (B) Quantification of puncta in the boxed region in tail fin. Scale bar: 100 µm. Results are presented as mean ± s.d. (N = 3 independent experiments with over 20 larvae each/experiment). ****, p<0.0001, Kruskal-Wallis test.
Acknowledgments
This image is the copyrighted work of the attributed author or publisher, and
ZFIN has permission only to display this image to its users.
Additional permissions should be obtained from the applicable author or publisher of the image.
Full text @ Front Immunol