
IMAGE
Fig. S3
- ID
- ZDB-IMAGE-180710-2
- Publication
- Andrzejczuk et al., 2018 - Tal1, Gata2a, and Gata3 Have Distinct Functions in the Development of V2b and Cerebrospinal Fluid-Contacting KA Spinal Neurons
- All Figures
- Figures for Andrzejczuk et al., 2018
Image
|
Figure Caption
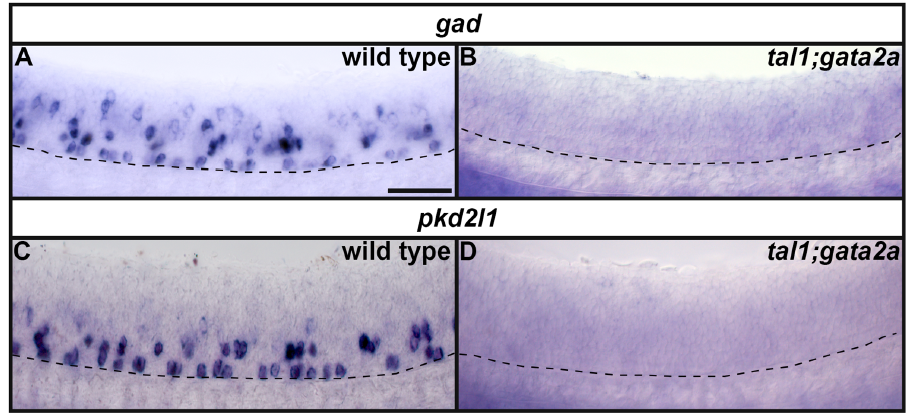
Fig. S3
gad and pkd2l1 expression in tal1;gata2a double mutants.
Lateral views of gad (A, B) or pkd2l1 (C, D) expression in 24h WT sibling (A, C) and tal1;gata2a double mutant embryos (B, D) as indicated. Dorsal, top; anterior, left. Scale bar = 50 microns. Dashed lines indicate ventral limit of spinal cord.
Acknowledgments
This image is the copyrighted work of the attributed author or publisher, and
ZFIN has permission only to display this image to its users.
Additional permissions should be obtained from the applicable author or publisher of the image.
Full text @ Front. Neurosci.