
Image
|
Figure Caption
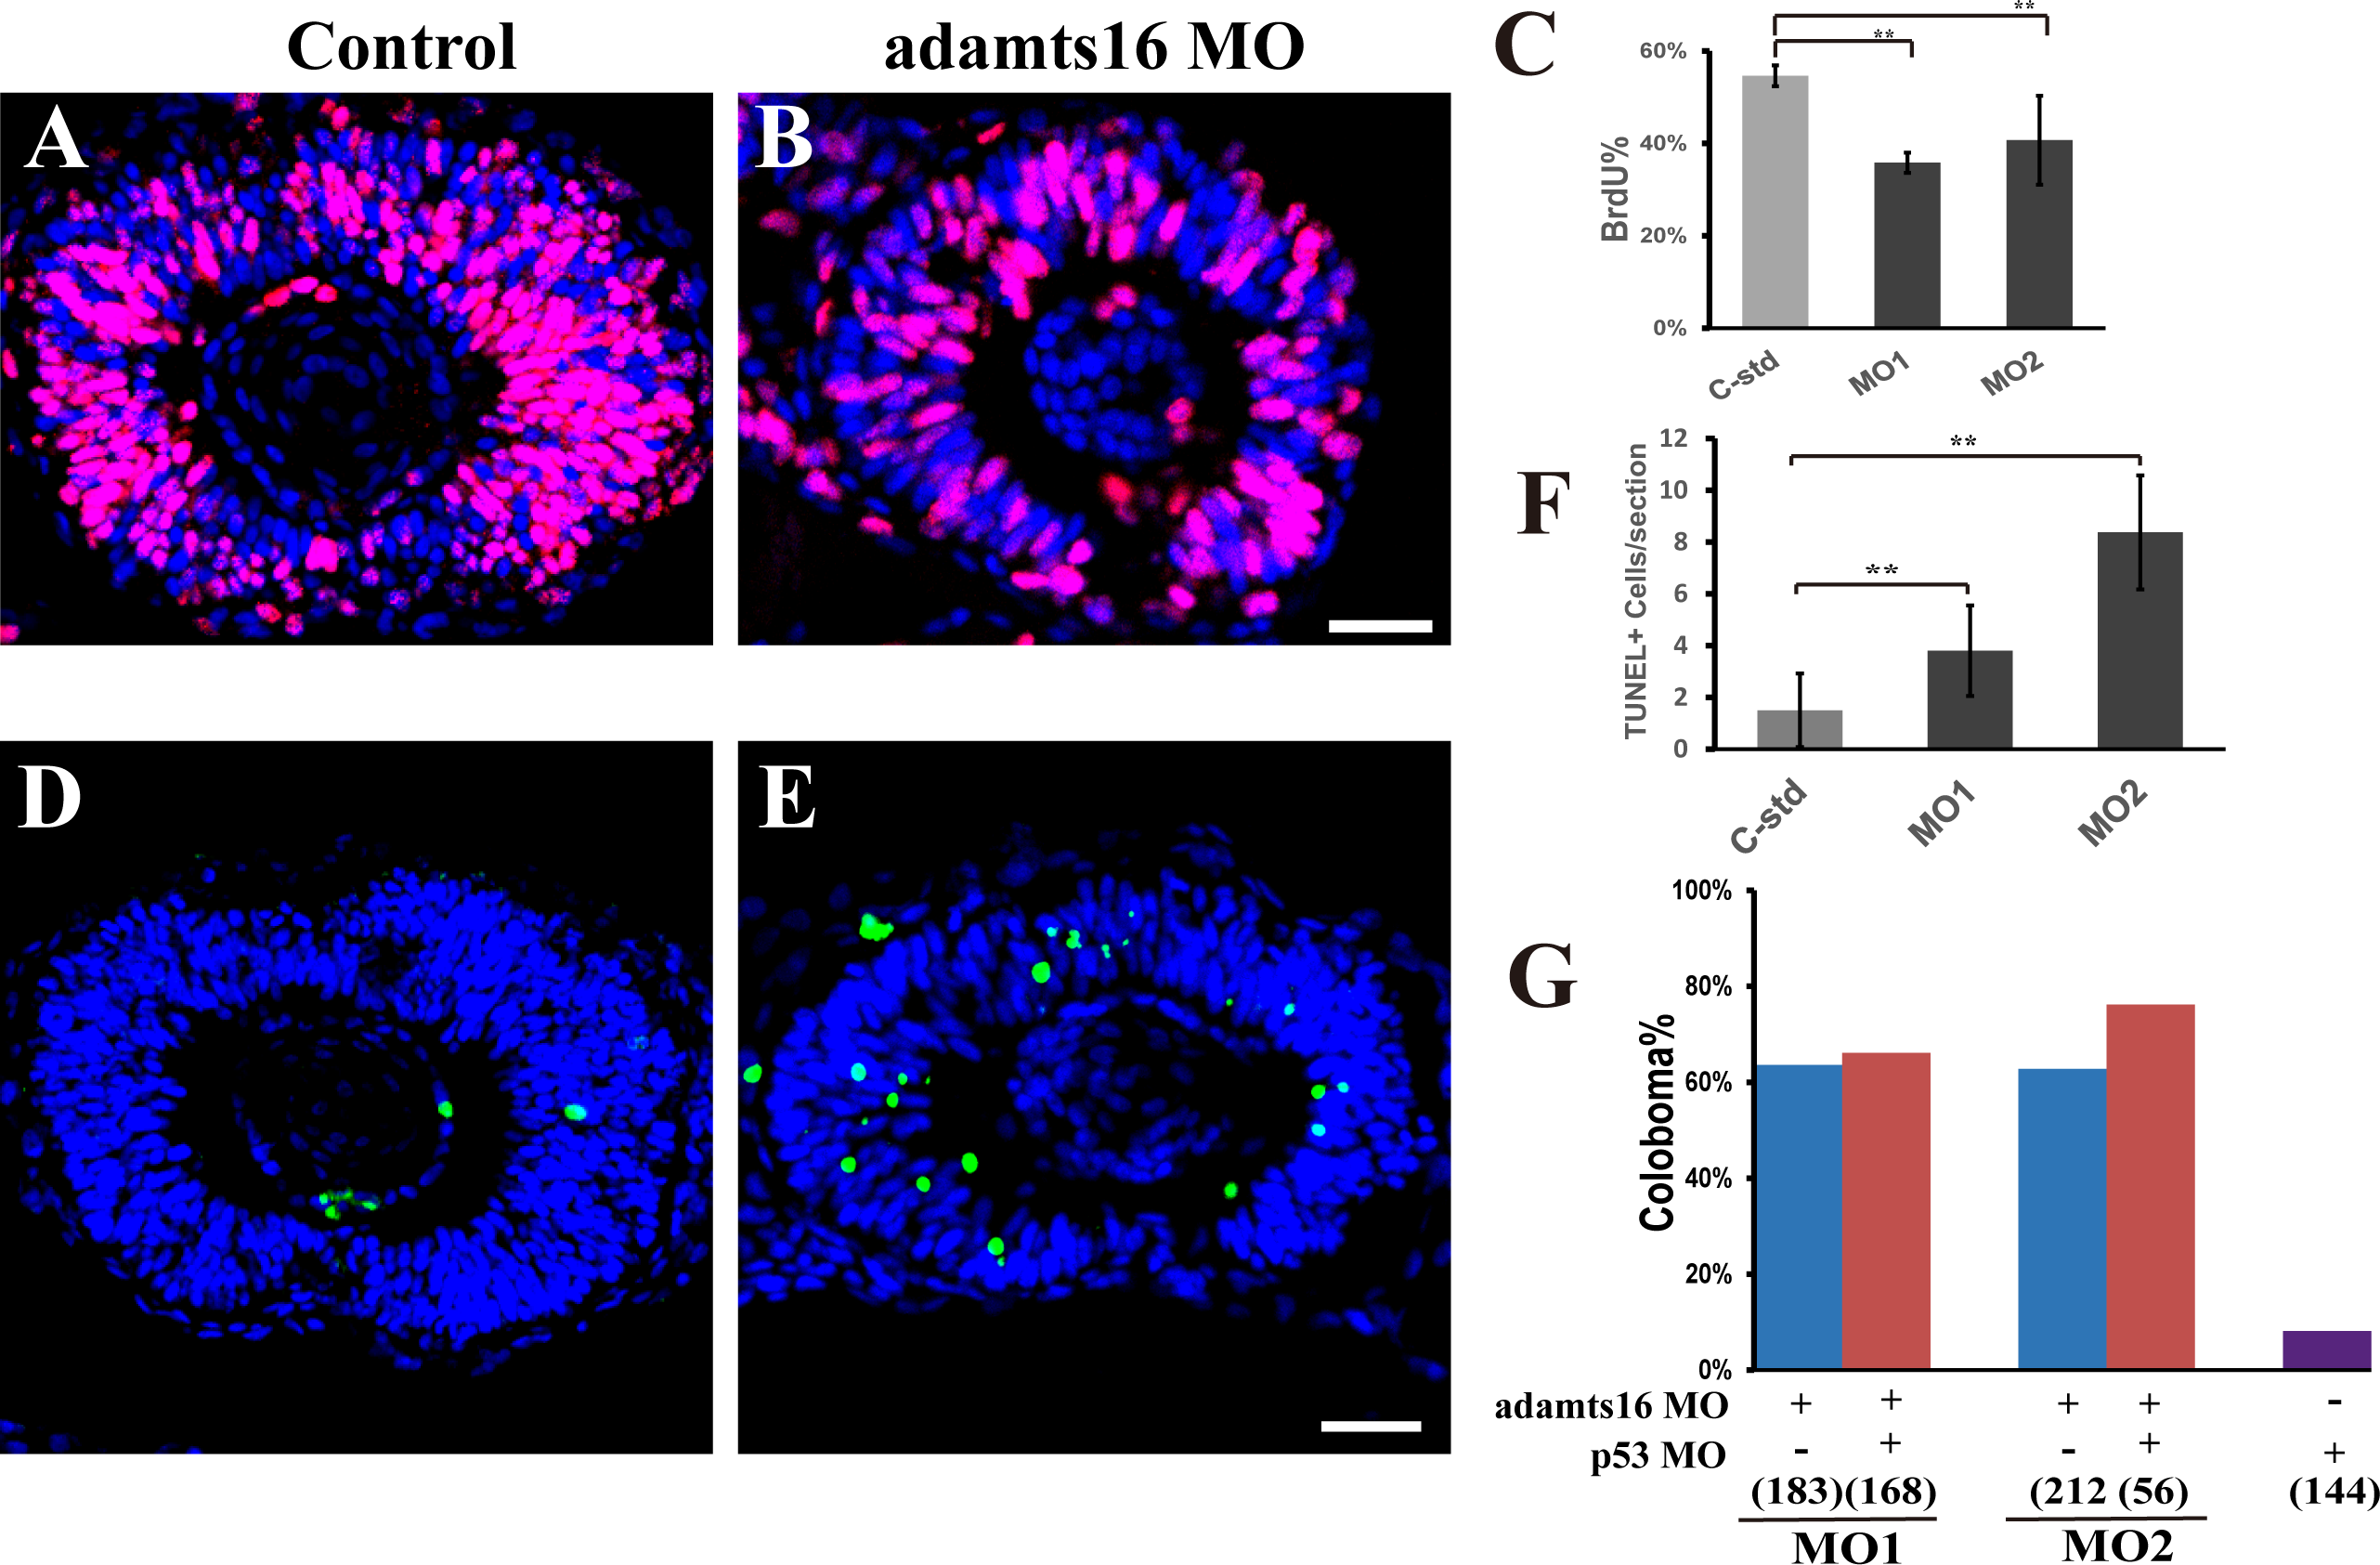
Fig. 4
adamts16-morphant OCs proliferate slowly, and exhibit increased apoptosis activity. (A, B) Images of 36-hpf zebrafish eye sagittal sections stained with anti-BrdU antibody (red). (C) Percentage quantification of BrdU+ cells/eye in control and MO1- and MO2-morphant groups. (D, E) TUNEL staining (green) of 36-hpf zebrafish eye sagittal sections. (F) Quantification of TUNEL+ cells/section in control, MO1-, and MO2-morphant groups. (G) Quantification of coloboma prevalence shows that the coloboma phenotype in MO1- or MO2-morphants could not be rescued by p53 MO knockdown. Numbers under each column denote the number of zebrafish injected in each group. Scale bars in (B) and (E): 50 μm.
Figure Data
Acknowledgments
This image is the copyrighted work of the attributed author or publisher, and
ZFIN has permission only to display this image to its users.
Additional permissions should be obtained from the applicable author or publisher of the image.
Full text @ Invest. Ophthalmol. Vis. Sci.