
IMAGE
Fig. 2
- ID
- ZDB-IMAGE-180706-48
- Publication
- Cao et al., 2018 - Metalloproteinase Adamts16 Is Required for Proper Closure of the Optic Fissure
- All Figures
- Figures for Cao et al., 2018
Image
|
Figure Caption
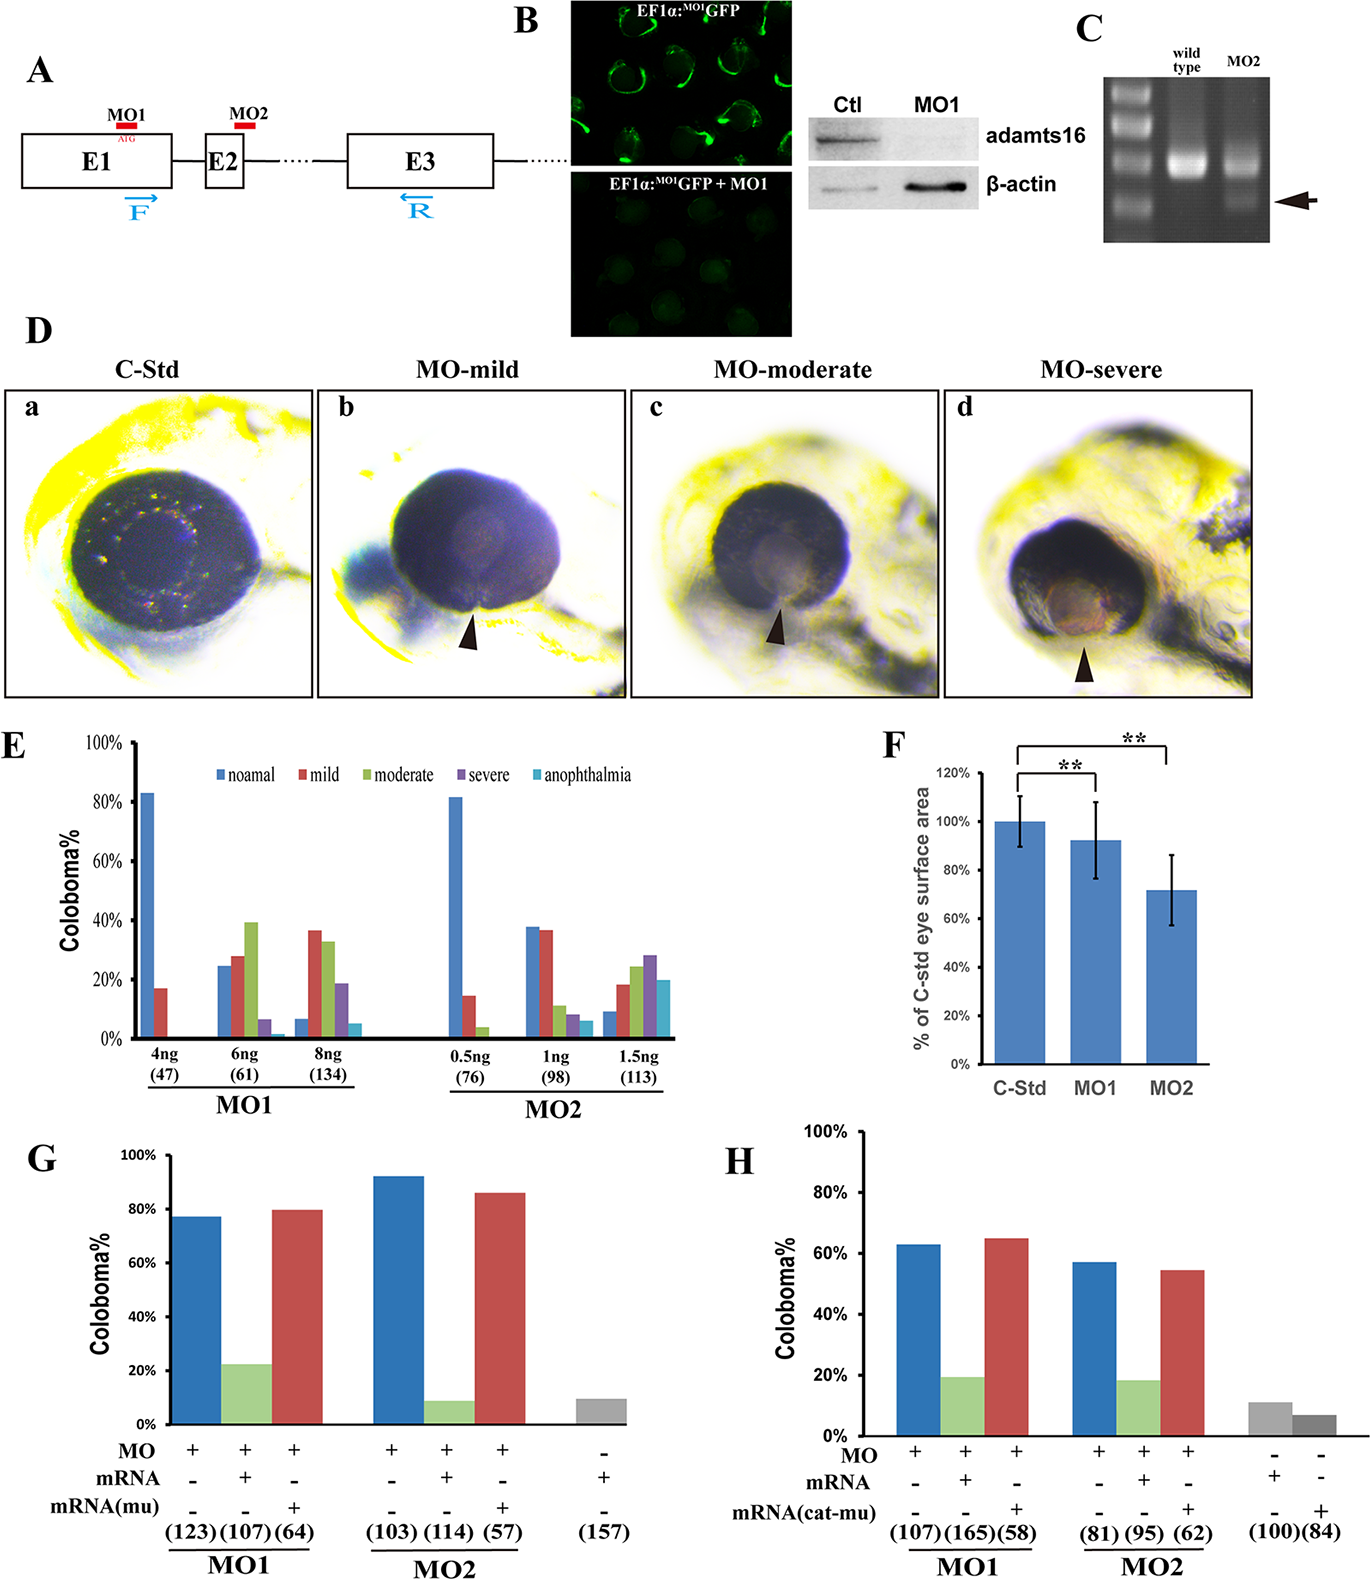
Fig. 2
adamts16 is required for zebrafish OF closure. Diagram illustrating a portion of the zebrafish adamts16 gene, MO1 and MO2 targeting sites, and primers used to examine splicing products before and after MO2 injection. (B) Left: MO1 knockdown efficacy reporter assay. Right: Western blot analysis showing adamts16 protein depletion from MO1-morphant fish bodies. (C) Testing MO2 knockdown efficacy by RT-PCR using primers indicated in (A); amplicons from control fish RNA were 401 bp, while MO2 disruption of splicing resulted in the appearance of smaller 319-bp amplicons (arrow). (D) Knockdown of adamts16 by either MO1 or MO2 resulted in coloboma and microphthalmia. (F) Eye surface area of MO1- and MO2-morphant zebrafish. Data were normalized as the percentage of average eye surface area to the standard control MO-injected zebrafish. (G) Quantification of coloboma prevalence shows that coloboma phenotype of MO1- or MO2-morphants can be rescued by adamts16 mRNA injection. (H) Quantification of coloboma prevalence shows that the coloboma phenotype in MO1- or MO2-morphants could not be rescued by the catalytic site–mutant form of adamts16 mRNA injection. Numbers under each column in (E), (G), and (H) denote the number of zebrafish injected in each group.
Figure Data
Acknowledgments
This image is the copyrighted work of the attributed author or publisher, and
ZFIN has permission only to display this image to its users.
Additional permissions should be obtained from the applicable author or publisher of the image.
Full text @ Invest. Ophthalmol. Vis. Sci.