
Fig. 6
- ID
- ZDB-IMAGE-180706-42
- Publication
- Nagao et al., 2018 - Distinct interactions of Sox5 and Sox10 in fate specification of pigment cells in medaka and zebrafish
- All Figures
- Figures for Nagao et al., 2018
|
Fig. 6
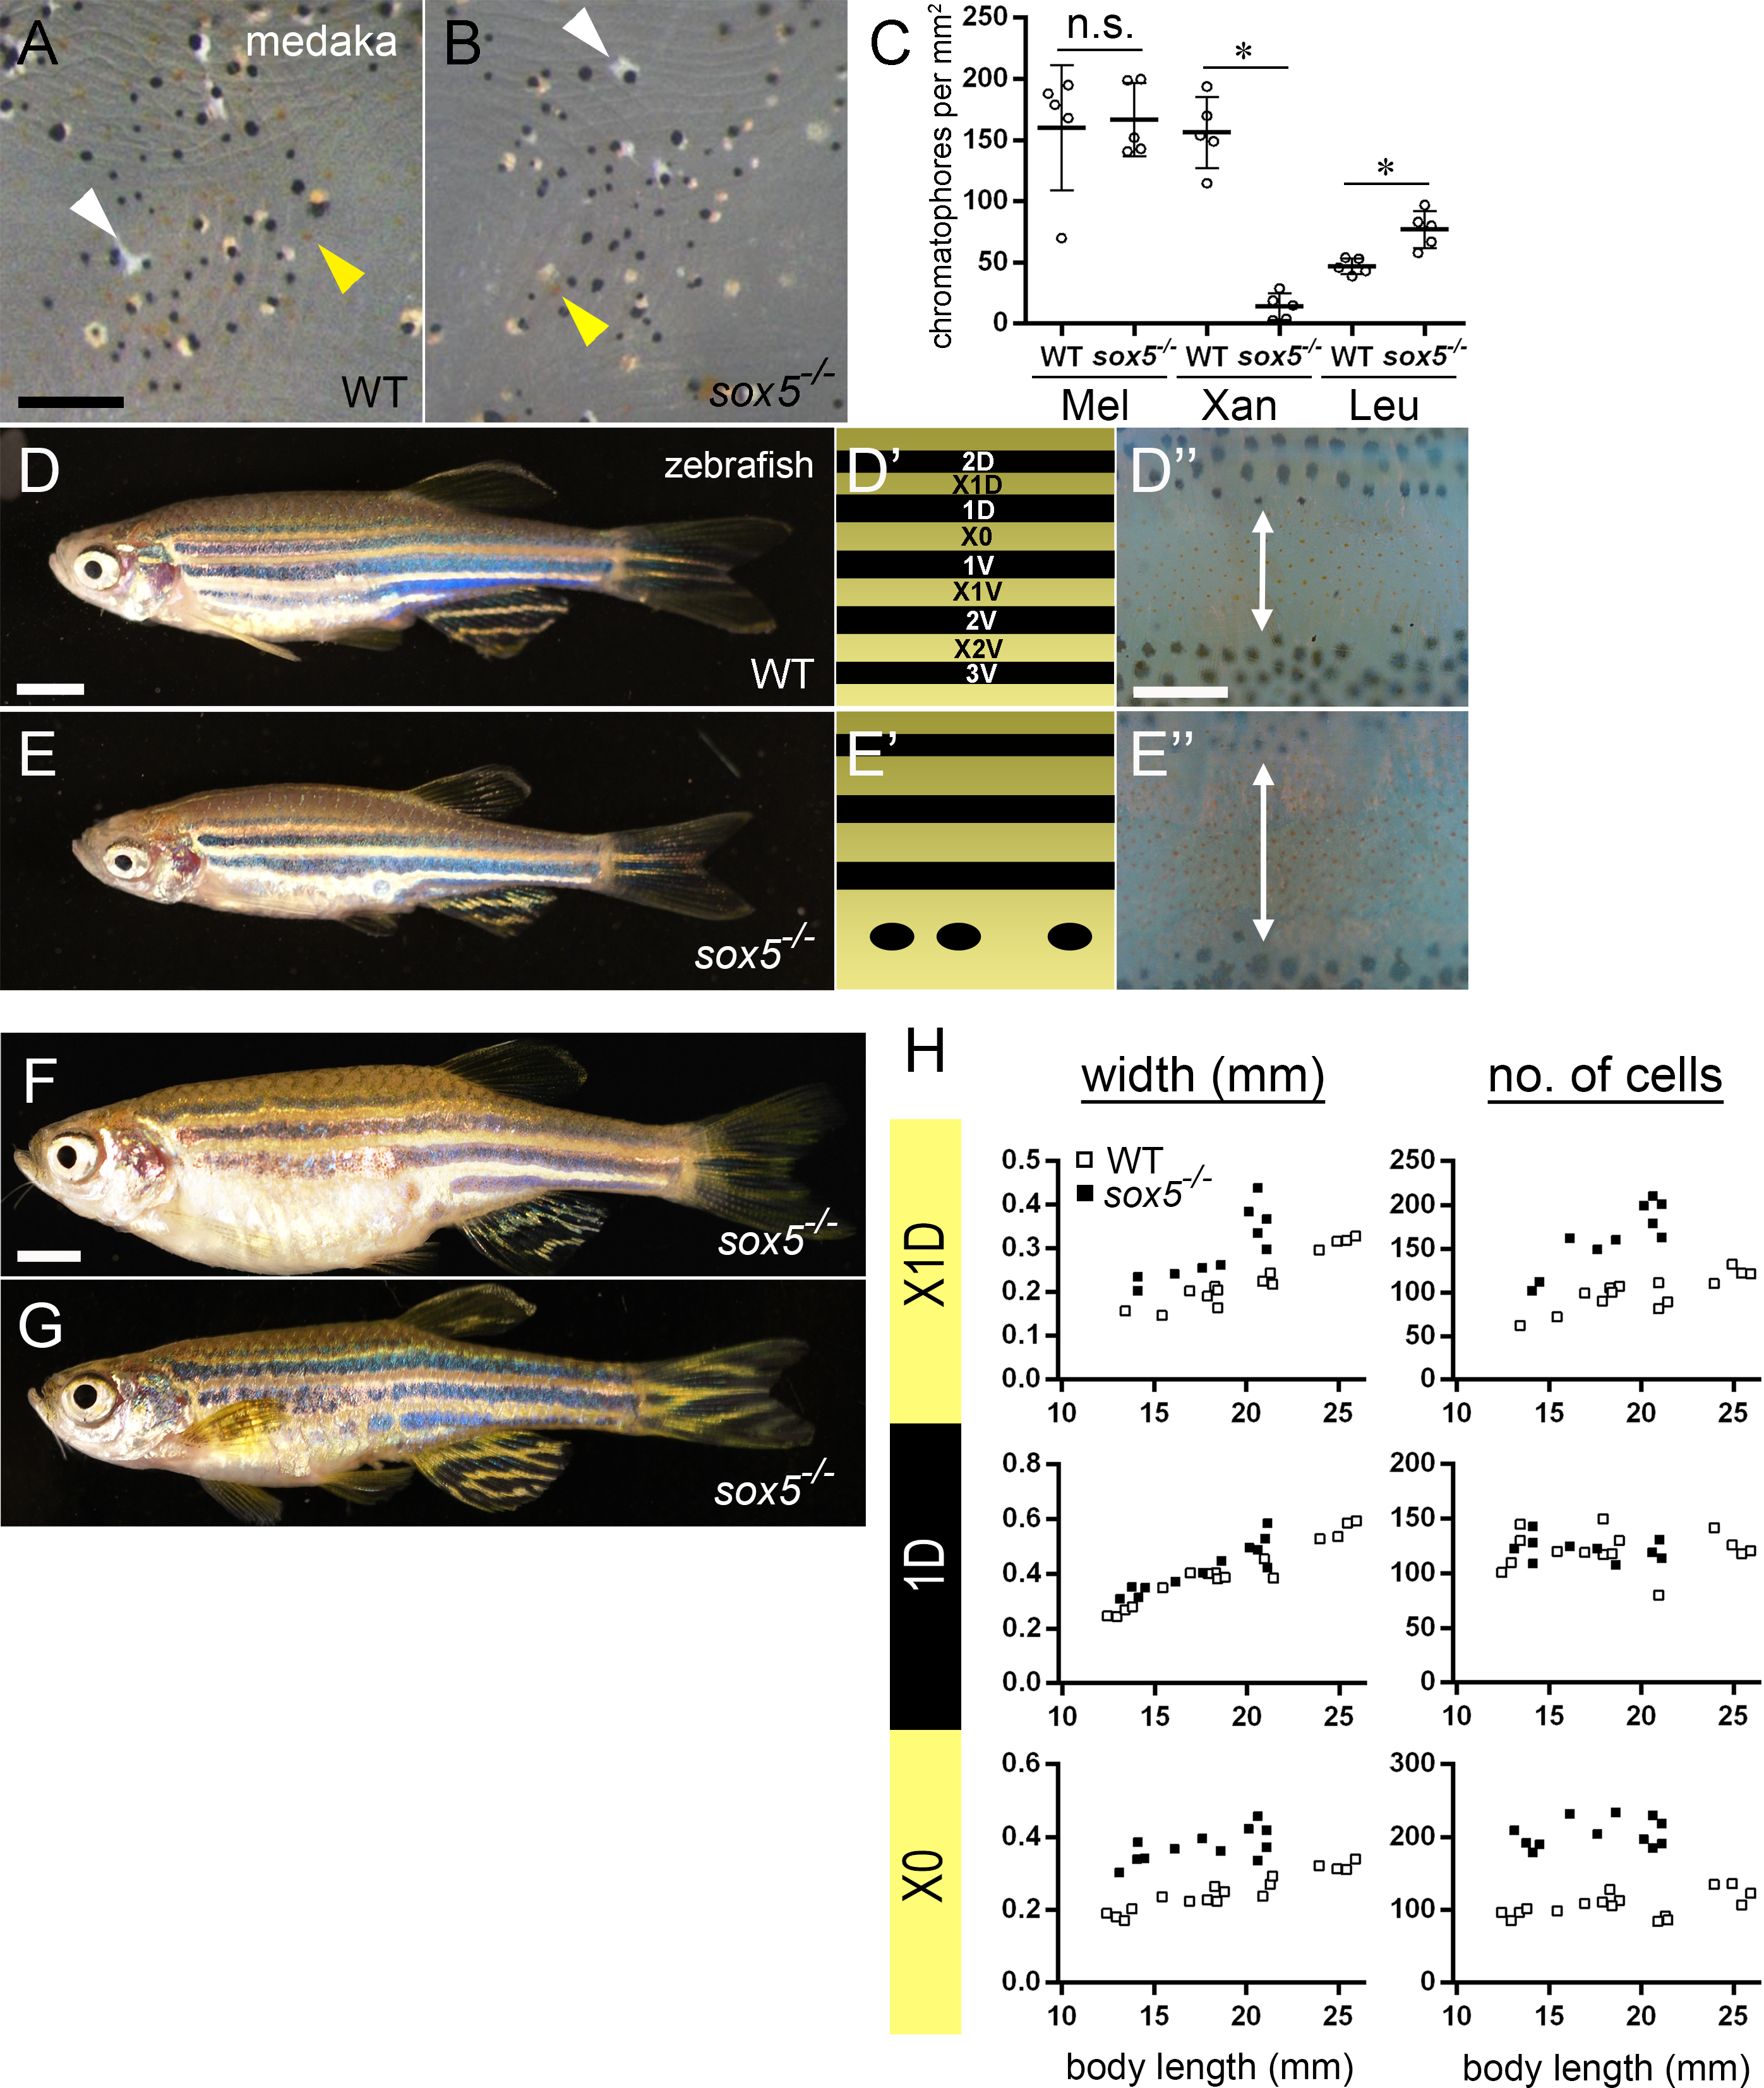
Role of Sox5 in adult xanthophore development in medaka remains opposite to that in zebrafish. (A, B) Medaka. 6 mpf. (D, E) Zebrafish. 2 mpf. (D’, E’) Schematics of stripe pattern. (D”, E”) Enlarged images of X0 interstripe. (F, G) Zebrafish. 1.5 years old. In WT medaka (A), melanocytes, xanthophores (yellow arrowhead) and leucophores (white arrowhead) are scattered on the body surface. sox5-/- mutant medaka (B) have fewer xanthophores and more leucophores than WT (C, Xan and Leu, *p<0.05 by Mann-Whitney test; WT, n = 5; sox5-/-, n = 5; Bars show mean and error bar (s.d.)). Pigment cells were counted from a 1 mm2 area on the dorsal body surface. The melanocyte numbers were not significantly different between WT and sox5-/- (C, Mel, p = 0.1 by Mann-Whitney test). The adult pigment pattern of WT zebrafish is composed of 5 melanocyte stripes (2D, 1D, 1V, 2V, 3V) and xanthophore interstripes (X1D, X0, X1V, X2V) (D, D’). Zebrafish sox5-/- mutants lack two ventral interstripes (2V and 3V) (E, E’), and thus have fewer stripes than WT. This is the case regardless of sex (F, female; G, male) after the mutant fish get larger and older than 1.5 years. The sox5-/- zebrafish mutants have wider X1D and X0 (two-way arrow in D” and E”) interstripes and larger numbers of xanthophores in these interstripes than WT. (H) Scatter plot of stripe width or pigment cell numbers in each stripe, comparing sox5-/- and their WT siblings. X axis shows the standard body length of zebrafish examined. Analysis of covariance was performed to examine the differences in width or cell numbers between WT and sox5-/- mutants, by using standard length as a covariate. The p values are as follows; width X1D (p<0.05), 1D (p<0.05), X0 (p<0.05), cell number X1D (p<0.05), 1D (p = 0.985), X0 (p<0.05). The width and number of xanthophore in the xanthophore stripes (X0, X1D) in sox5-/- mutants (black boxes) show significant increase compared with WT siblings (white boxes). The number of melanocyte in the 1D stripe is comparable between WT (white boxes) and sox5-/- mutant (black boxes), but the width is slightly but significantly different (p<0.05). Scale bar: (A) 200 μm, (D) 3 mm, (D”) 200 μm, (F) 3 mm.