
Fig. 4
- ID
- ZDB-IMAGE-180705-64
- Genes
- Antibodies
- Publication
- Ogungbenro et al., 2018 - Centrobin controls primary ciliogenesis in vertebrates
- All Figures
- Figures for Ogungbenro et al., 2018
|
Fig. 4
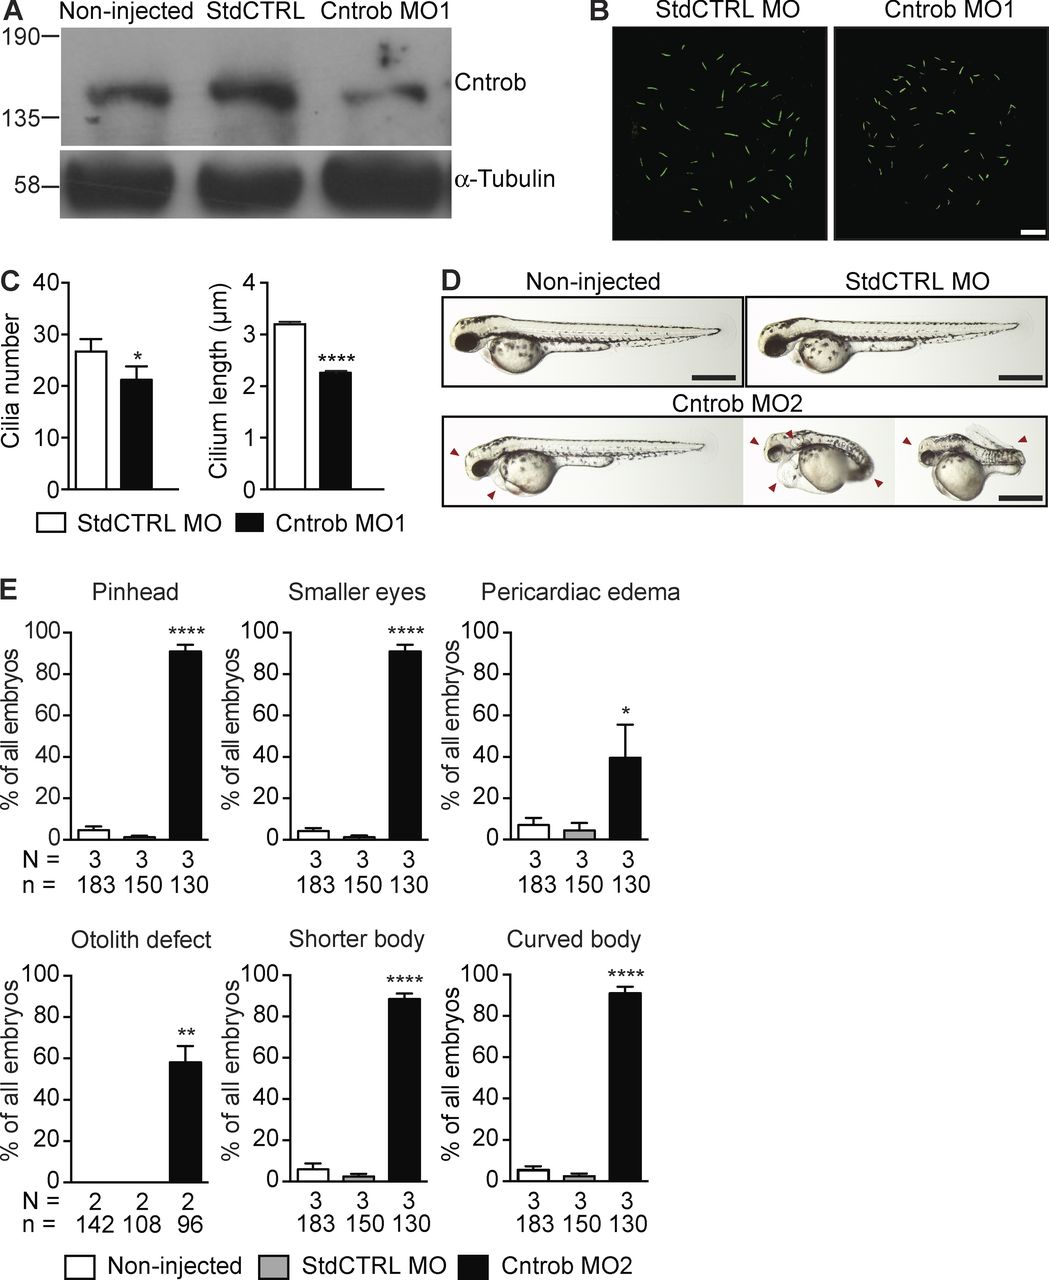
Centrobin loss causes ciliary and developmental defects in zebrafish embryos. MO1 was directed to the centrobin ATG and MO2 to the 5′ UTR. (A) Immunoblot analysis of efficacy of the centrobin knockdown in zebrafish embryos at 24 hpf. (B) Confocal stacks of cilia in KV in 8 ss zebrafish embryos injected with the standard control MO (StdCTRL MO) or MO targeting the translation start site of centrobin. Cilia were visualized with an antibody to acetylated tubulin (green). Bar, 10 µm. (C) Quantitation of ciliation frequency and length in KV after injection with the indicated MOs showing mean + SEM of four independent experiments in which 40 standard control MO and 33 Cntrob MO-treated KVs were quantitated by acetylated tubulin staining. In standard control embryos, 1067 cilia were measured, and in Cntrob MO embryos, 750 cilia. *, P < 0.01; ***, P < 0.0001; unpaired t test. (D) Live images show gross phenotypes of zebrafish embryos injected with control or Cntrob MOs at 24 hpf. Arrowheads indicate morphological abnormalities. Bars, 500 nm. (E) Quantitation of developmental phenotypes in centrobin-deficient embryos. Each phenotype was quantitated over three experiments in the indicated number of zebrafish embryos and graphs indicate means + SEM. *, P < 0.05; **, P < 0.01; ****, P < 0.0001, by one-way ANOVA.