
IMAGE
Fig. 1
- ID
- ZDB-IMAGE-180628-2
- Genes
- Publication
- Kumar et al., 2018 - Microvillar and ciliary defects in zebrafish lacking an actin-binding bioactive peptide amidating enzyme
- All Figures
- Figures for Kumar et al., 2018
Image
|
Figure Caption
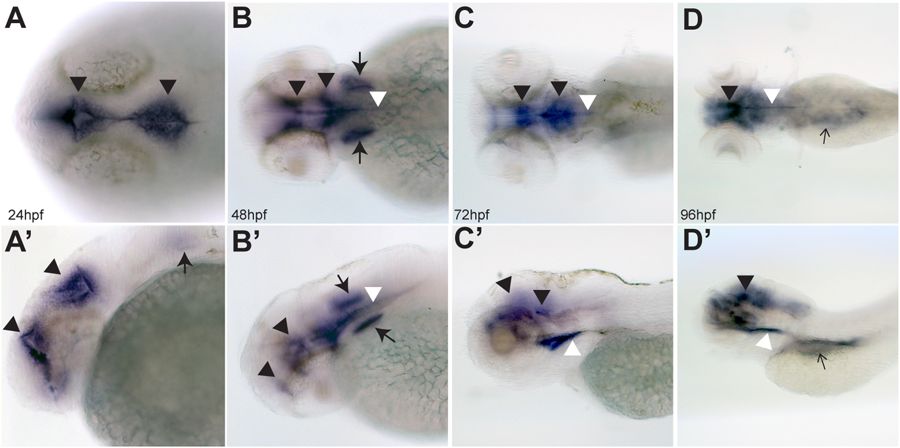
Fig. 1
PAM expression in zebrafish embryos. Dorsal (A–D) and lateral (A’–D’) views of zebrafish embryos at 24, 48, 72 and 96 hpf visualized by in situ hybridization with an antisense probe for pam; staining with the sense control probe using the same processing conditions is shown in Supplemental Fig. S1. pam mRNA expression is detected in the ependyma lining the developing ventricles (black arrowheads), otic vesicles (thick arrows), floor plate (white arrowheads), and was also diffusely abdominal (thin black arrows in panels D and D’). No pam expression was evident in the eye or cardiac tissue.
Figure Data
Acknowledgments
This image is the copyrighted work of the attributed author or publisher, and
ZFIN has permission only to display this image to its users.
Additional permissions should be obtained from the applicable author or publisher of the image.
Full text @ Sci. Rep.