
Fig. 4
- ID
- ZDB-IMAGE-180628-1
- Genes
- Publication
- Lambert et al., 2018 - An automated system for rapid cellular extraction from live zebrafish embryos and larvae: Development and application to genotyping
|
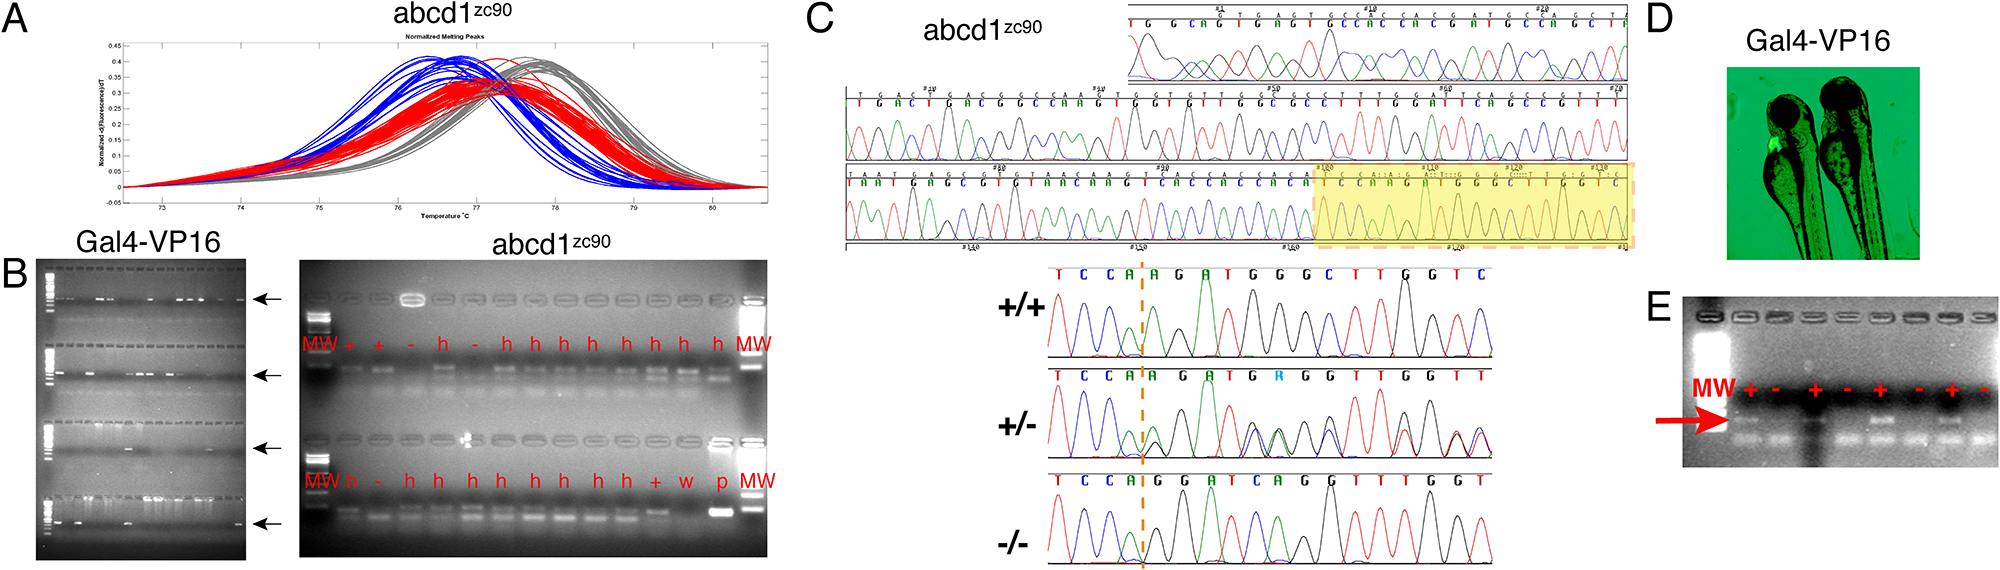
Fig. 4
Multi-modal analysis of genetic material collected from ZEG.
A) HRMA analysis of embryos carrying a nucleotide point mutation in the abcd1 gene. Red curves, wild-type; blue curves, heterozygous mutant; gray curves, homozygous mutant. X-axis, melt temperature (°C); y-axis, normalized change in fluorescence with temperature. B) Agarose gel electrophoresis: left, PCR for Gal4-VP16 in 74 embryos; positive results are easily scored (arrows). 2% agarose gel, four rows of lanes, 20 wells/lane, molecular weight marker at far left, final two wells in upper right are negative control and positive control. Right, PCR for abcd1zc90; scoring is indicated above each well; MW, molecular weight; +, wild-type; -, homozygous mutant; h, heterozygous; w, water control; p, positive control. C) Chromatogram sequence results from sequencing PCR products of abcd1zc90 genotyping. Example of entire amplicon sequence read shown; highlighted area shown below in higher resolution for three different genotypes (wild-type, heterozygous, and homozygous). Dotted orange line indicates start of 12-bp mutant insertion. D) 72 hpf larvae; left larva is transgenic and GFP expression is visible in the heart. E) Gal4 amplicons (red arrow) from alternating GFP+ and GFP- larvae. Gal4 amplicon is seen in every lane in which the larvae was scored positive by visible presence of GFP+ heart seen under fluorescence microscope, and no amplicon in GFP- larvae. MW, molecular weight marker.