
Fig. S6
- ID
- ZDB-IMAGE-180627-17
- Publication
- Hayes et al., 2018 - Vangl2/RhoA Signaling Pathway Regulates Stem Cell Self-Renewal Programs and Growth in Rhabdomyosarcoma
- All Figures
- Figures for Hayes et al., 2018
|
Fig. S6
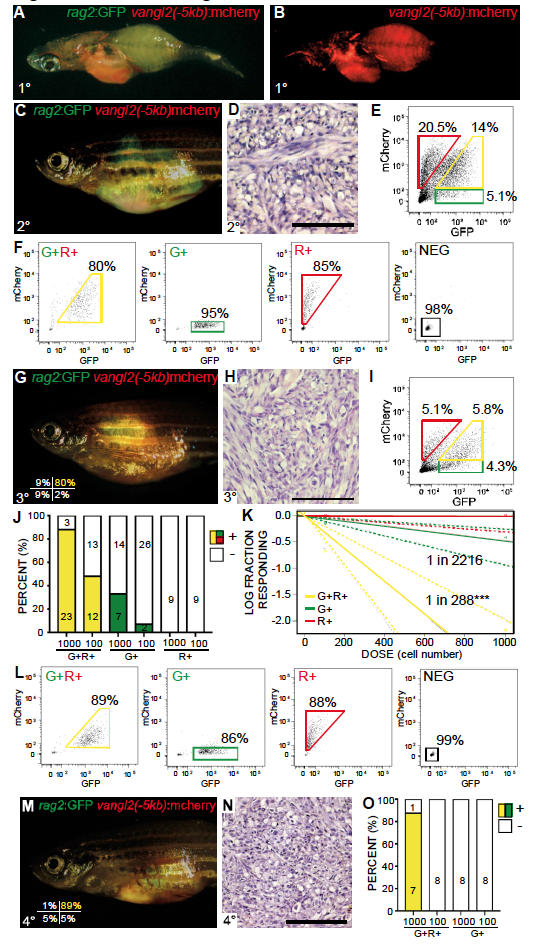
Related to Figure 6. vangl2:mCherry labels self-renewing TPCs in zebrafish ERMS. (A,B) Transgenic zebrafish with primary ERMS expressing vangl2(-5kb):mCherry along with rag2:GFP + rag2:kRASG12D. (C) Whole animal and (D) histology of syngeneic zebrafish engrafted with fluorescently-labeled ERMS imaged at 30 days post transplantation (1x10⁵ unsorted tumor cells/animal). (E) FACS of rag2:GFP/vangl2:mCherry ERMS cells isolated from the transplant fish shown in C. (F) Sort purity of cells following FACS. (G-K) Sorted cell fractions were introduced into recipient fish at limiting dilution. Whole animal (G), histology (H) and FACS analysis (I) of fish engrafted with rag2:GFP+/vangl2:mCherry+ sorted cells. Sort purity of engrafted cells shown in lower left panel G. (J) Quantification of engraftment into syngeneic recipient animals (combined results from analysis of three independent ERMS, n=118 recipient fish total). rag2:GFP+/vangl2:mCherry+ (G+R+, yellow), rag2:GFP+/vangl2:mCherry- (G+, green) and rag2:GFP-/vangl2:mCherry+ (R+, red) tumor cells. (K) Graphical analysis of Extreme Limiting Dilution Analysis (ELDA) denoting overall engraftment rates at various cell dilutions. Dotted lines represent 95% confidence intervals. Estimated tumor propagating cell number for each cell fraction is indicated. ***p<0.001. (L) Sort purity of fluorescent-labeled ERMS cells isolated from tertiary recipient fish following two rounds of FACS. (M) Fluorescent image of fish engrafted with rag2:GFP+/vangl2:mCherry+ ERMS cells, establishing long-term and serial repopulating ability of Vangl2+ TPCs. Sort purity of engrafted cells is indicated in lower left panel M (viability >96%). (N) Histology of fish shown in M. (O) Quantification of tumor engraftment by 90 days post transplantation with sorted ERMS cells, rag2:GFP+/vangl2:mCherry+ (G+R+, yellow) and rag2:GFP+/vangl2:mCherry- (G+, green) cells.