
Fig. S5
- ID
- ZDB-IMAGE-180627-16
- Publication
- Hayes et al., 2018 - Vangl2/RhoA Signaling Pathway Regulates Stem Cell Self-Renewal Programs and Growth in Rhabdomyosarcoma
- All Figures
- Figures for Hayes et al., 2018
|
Fig. S5
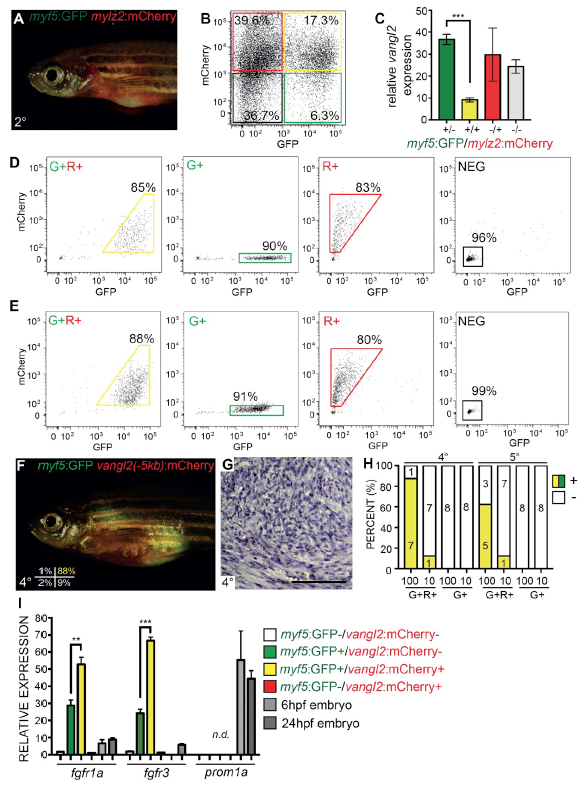
Related to Figure 6. Vangl2 transcripts are highly expressed in zebrafish TPCs, sort purity for experiments shown in Figure 6 and establishing long-term selfrenewal potential of myf5:GFP+/vangl2:mCherry+ TPCs. (A) Animal shown following engraftment of bulk myf5:GFP/mylz2:mCherry tumor cells. (B) FACS plot of isolated myf5:GFP+/mylz2:mCherry- (green), myf5:GFP+/mylz2:mCherry+ (yellow), myf5:GFP- /mylz2:mCherry+ (red) and myf5:GFP-/mylz2:mCherry- (black) ERMS cells. Percentage of cells in each gated sub-population are noted. (C) Quantitative RT-PCR analysis for vangl2 expression in sorted myf5:GFP+/mylz2:mCherry- (+/-, green), myf5:GFP+/mylz2:mCherry+ (+/+, yellow), myf5:GFP-/mylz2:mCherry+ (-/+, red) and myf5:GFP-/mylz2:mCherry- (-/-, grey) cells. Sort purity was >85% and >95% cell viability. ***p<0.001, Student’s t-test. Error bars represent standard deviation. Graph is representative of n=2 independent ERMS. (D) FACS plots showing sort purity for tumor cells engrafted into recipient animals depicted in Figure 6FJ. (E-H) Establishing long-term self-renewal potential of myf5:GFP+/vangl2:mCherry+ TPCs. Sort purity of cells isolated from fish engrafted with myf5:GFP+/vangl2:mCherry+ TPCs (E) and then engrafted into recipient fish F-H. Whole animal fluorescent image (F), histology (G), and quantification of engraftment at varying cell doses (H). myf5:GFP+/vangl2:mCherry+ (G+R+, yellow), myf5:GFP+/vangl2:mCherry- (G+, green) cells. (I) Relative expression of fgfr1a, fgfr3 and cd133/prominin1a (prom1a) in sorted myf5:GFP+/vangl2:mCherry- (G+), myf5:GFP+/vangl2:mCherry+ (G+R+), myf5:GFP-/vangl2:mCherry+ (R+), myf5:GFP- /vangl2:mCherry- (NEG) cells and compared with whole zebrafish embryos at 6 and 24 hours post fertilization (hpf). prom1a is not detected in zebrafish ERMS. Graph is representative of n=2 independent ERMS.