
Fig. 6
- ID
- ZDB-IMAGE-180627-14
- Publication
- Hayes et al., 2018 - Vangl2/RhoA Signaling Pathway Regulates Stem Cell Self-Renewal Programs and Growth in Rhabdomyosarcoma
- All Figures
- Figures for Hayes et al., 2018
|
Fig. 6
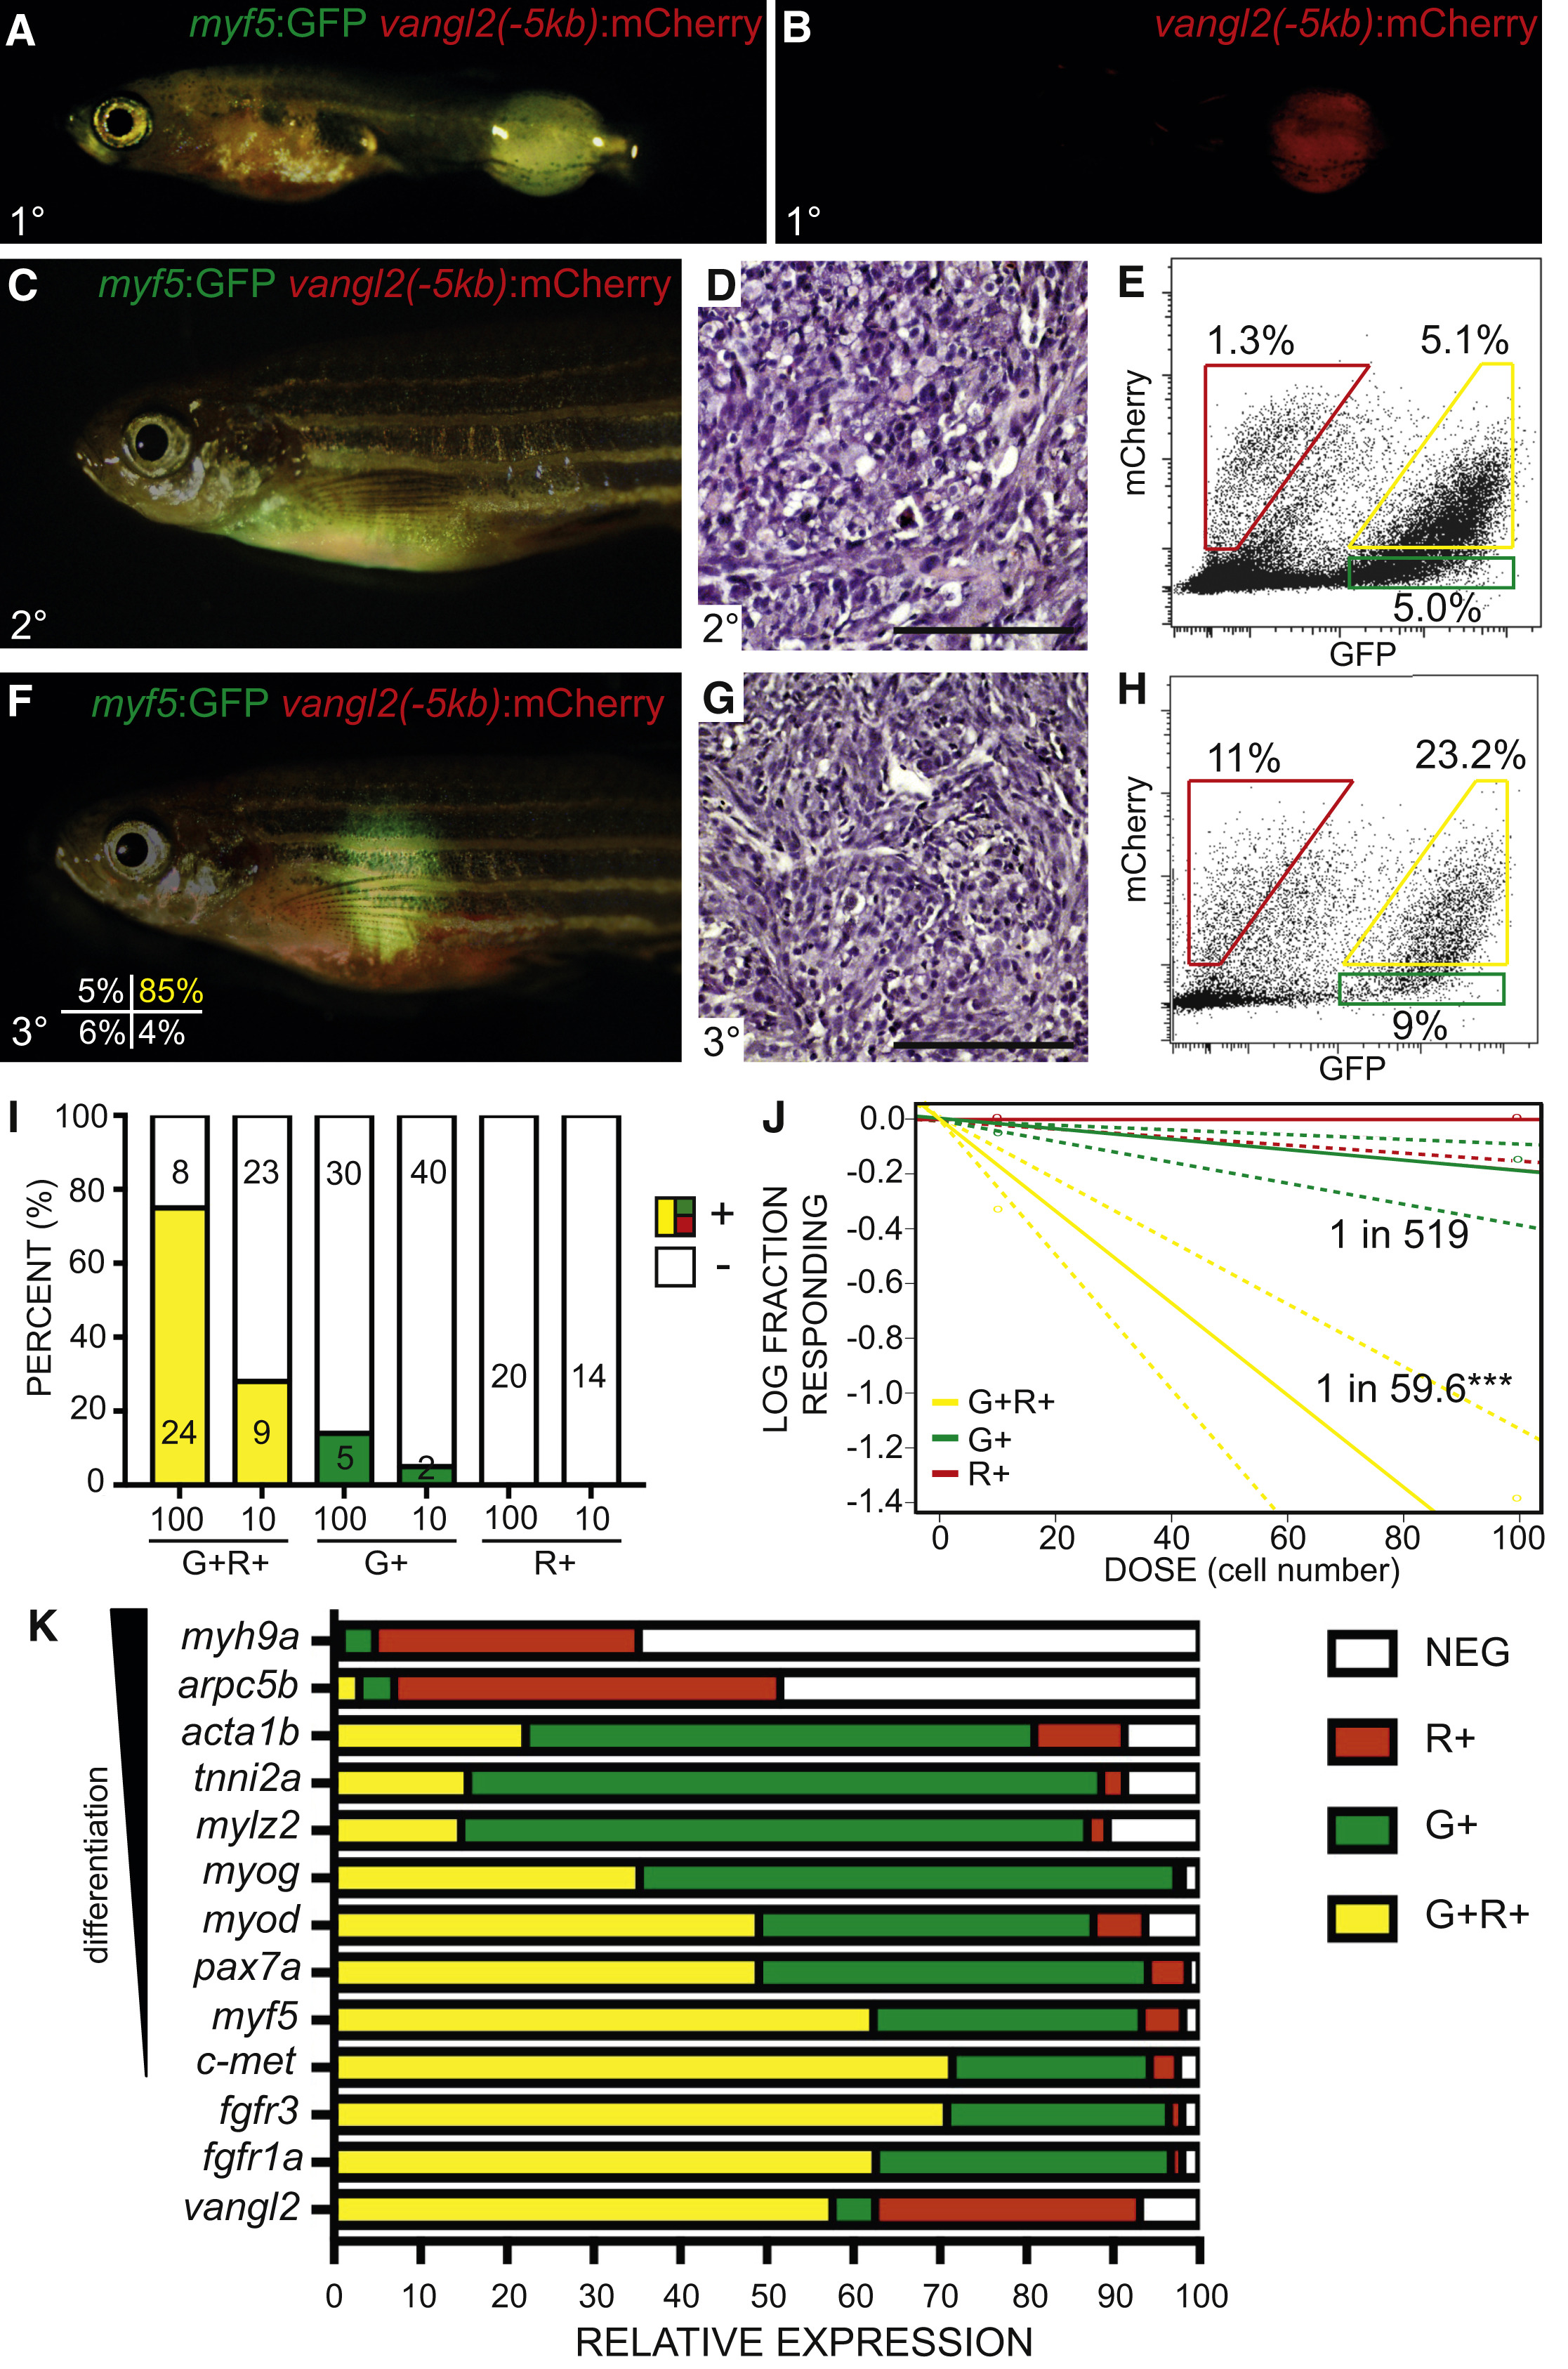
vangl2:mCherry Enriches for Self-Renewing TPCs in Zebrafish kRASG12D-Induced ERMS
(A and B) Transgenic zebrafish with primary ERMS expressing vangl2(−5kb):mCherry and Tg(myf5:GFP).
(C–E) Transplant fish engrafted with unsorted myf5:GFP/vangl2:mCherry ERMS shown 30 days post transplantation. Whole animal imaging (C), histology (D), and FACS of ERMS cells obtained at sacrifice (E).
(F–J) Syngeneic zebrafish engrafted with purified myf5:GFP+/vangl2:mCherry+ ERMS cells. Sort purity of engrafted cells is denoted in the lower left panel of (F). Whole animal imaging (F), histology (G), and FACS of ERMS cells obtained at sacrifice (H). (I) Quantification of engraftment of myf5:GFP+/vangl2:mCherry+ (G+R+, yellow), myf5:GFP+/vangl2:mCherry− (G+, green) and myf5:GFP−/vangl2:mCherry+ (R+, red) tumor cells (data are compiled from four independent ERMS and shown as individuals in Table S3, n = 170 recipient fish total). Number of engrafted animals is denoted and percent engraftment annotated by colored bars (+). (J) Graphical analysis of extreme limiting dilution analysis (ELDA) with the fraction of TPCs found in each sorted cell fraction denoted. Dotted lines represent 95% confidence intervals. ∗∗∗p < 0.001 (data compiled from four independent tumors, as above).
(K) qRT-PCR gene expression analysis performed on sorted myf5:GFP+/vangl2:mCherry+ (G+R+, yellow), myf5:GFP+/vangl2:mCherry− (G+, green), myf5:GFP−/vangl2:mCherry+ (R+, red) and myf5:GFP−/vangl2:mCherry− (NEG, white) cells. Relative expression for each gene is depicted and displayed for each subpopulation. Analysis is representative of two independent tumors (n = 2) run as technical triplicates. myf5:GFP+/vangl2:mCherry+ cells enrich for markers of ERMS TPCs including c-met, myf5, fgfr1a, and fgfr3 (p < 0.01, Student’s t test).