
Fig. 5
- ID
- ZDB-IMAGE-180627-13
- Publication
- Hayes et al., 2018 - Vangl2/RhoA Signaling Pathway Regulates Stem Cell Self-Renewal Programs and Growth in Rhabdomyosarcoma
- All Figures
- Figures for Hayes et al., 2018
|
Fig. 5
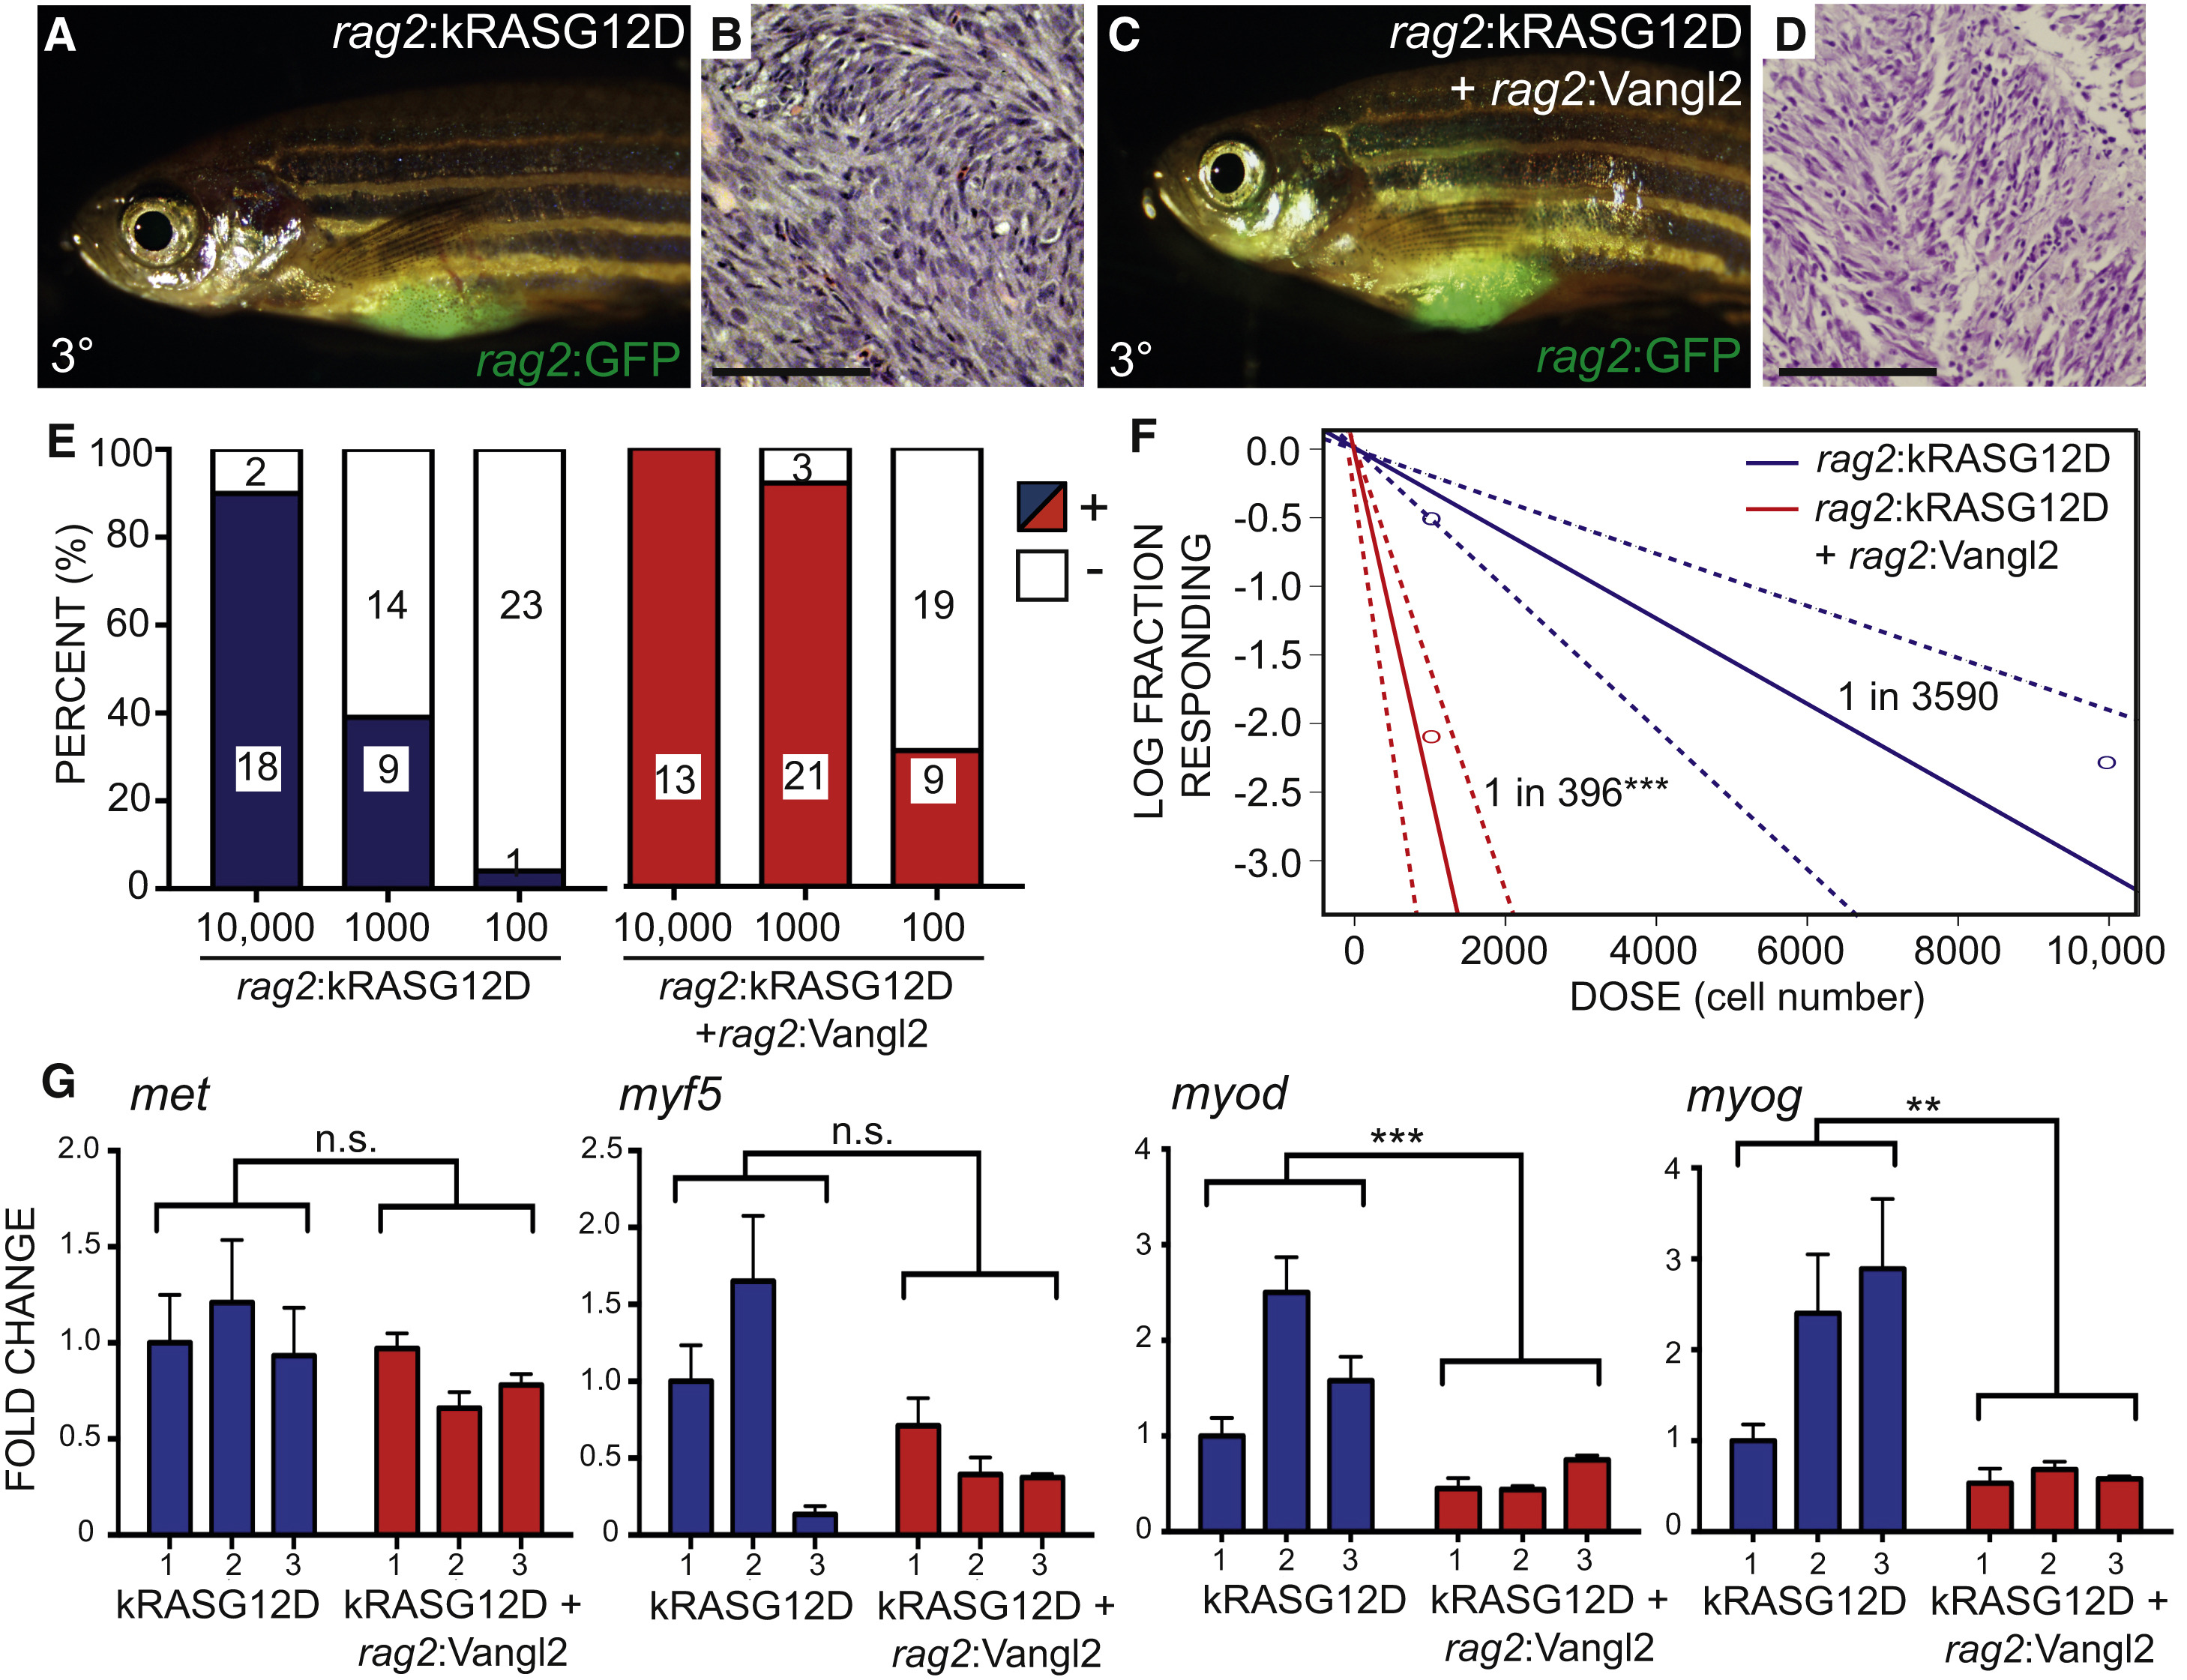
Vangl2 Elevates Tumor Propagating Cell Number 9-Fold in Zebrafish kRASG12D-Induced ERMS
(A–D) Representative images of syngeneic zebrafish engrafted with 1 − 104 sorted GFP+ ERMS cells and analyzed at 30 days post transplantation. ERMS expressing rag2:kRASG12D + rag2:GFP (A and B) or rag2:kRASG12D + rag2:Vangl2 + rag2:GFP (C and D). Representative images of tumor histology (B and D).
(E) Quantification of fish engrafted with 104, 103, and 102 GFP+ tumor cells that co-expressed rag2:kRASG12D with or without rag2:Vangl2 (data compiled from engraftment of 3 independent tumors/genotype).
(F) Graphical analysis of extreme limiting dilution analysis (ELDA) denoting overall engraftment rates at various cell dilutions. Dotted lines represent 95% confidence intervals. Estimated tumor propagating cell number for each genotype is noted (data compiled from engraftment of 3 independent unmixed tumors/genotype). ∗∗∗p < 0.001.
(G) qRT-PCR gene expression analysis performed on sorted rag2:GFP ERMS cells (independent ERMS are represented and numbered on the x axis). ∗∗p < 0.01, ∗∗∗p < 0.001; n.s., not significant, two-way ANOVA. Error bars denote SD.