
Image
|
Figure Caption
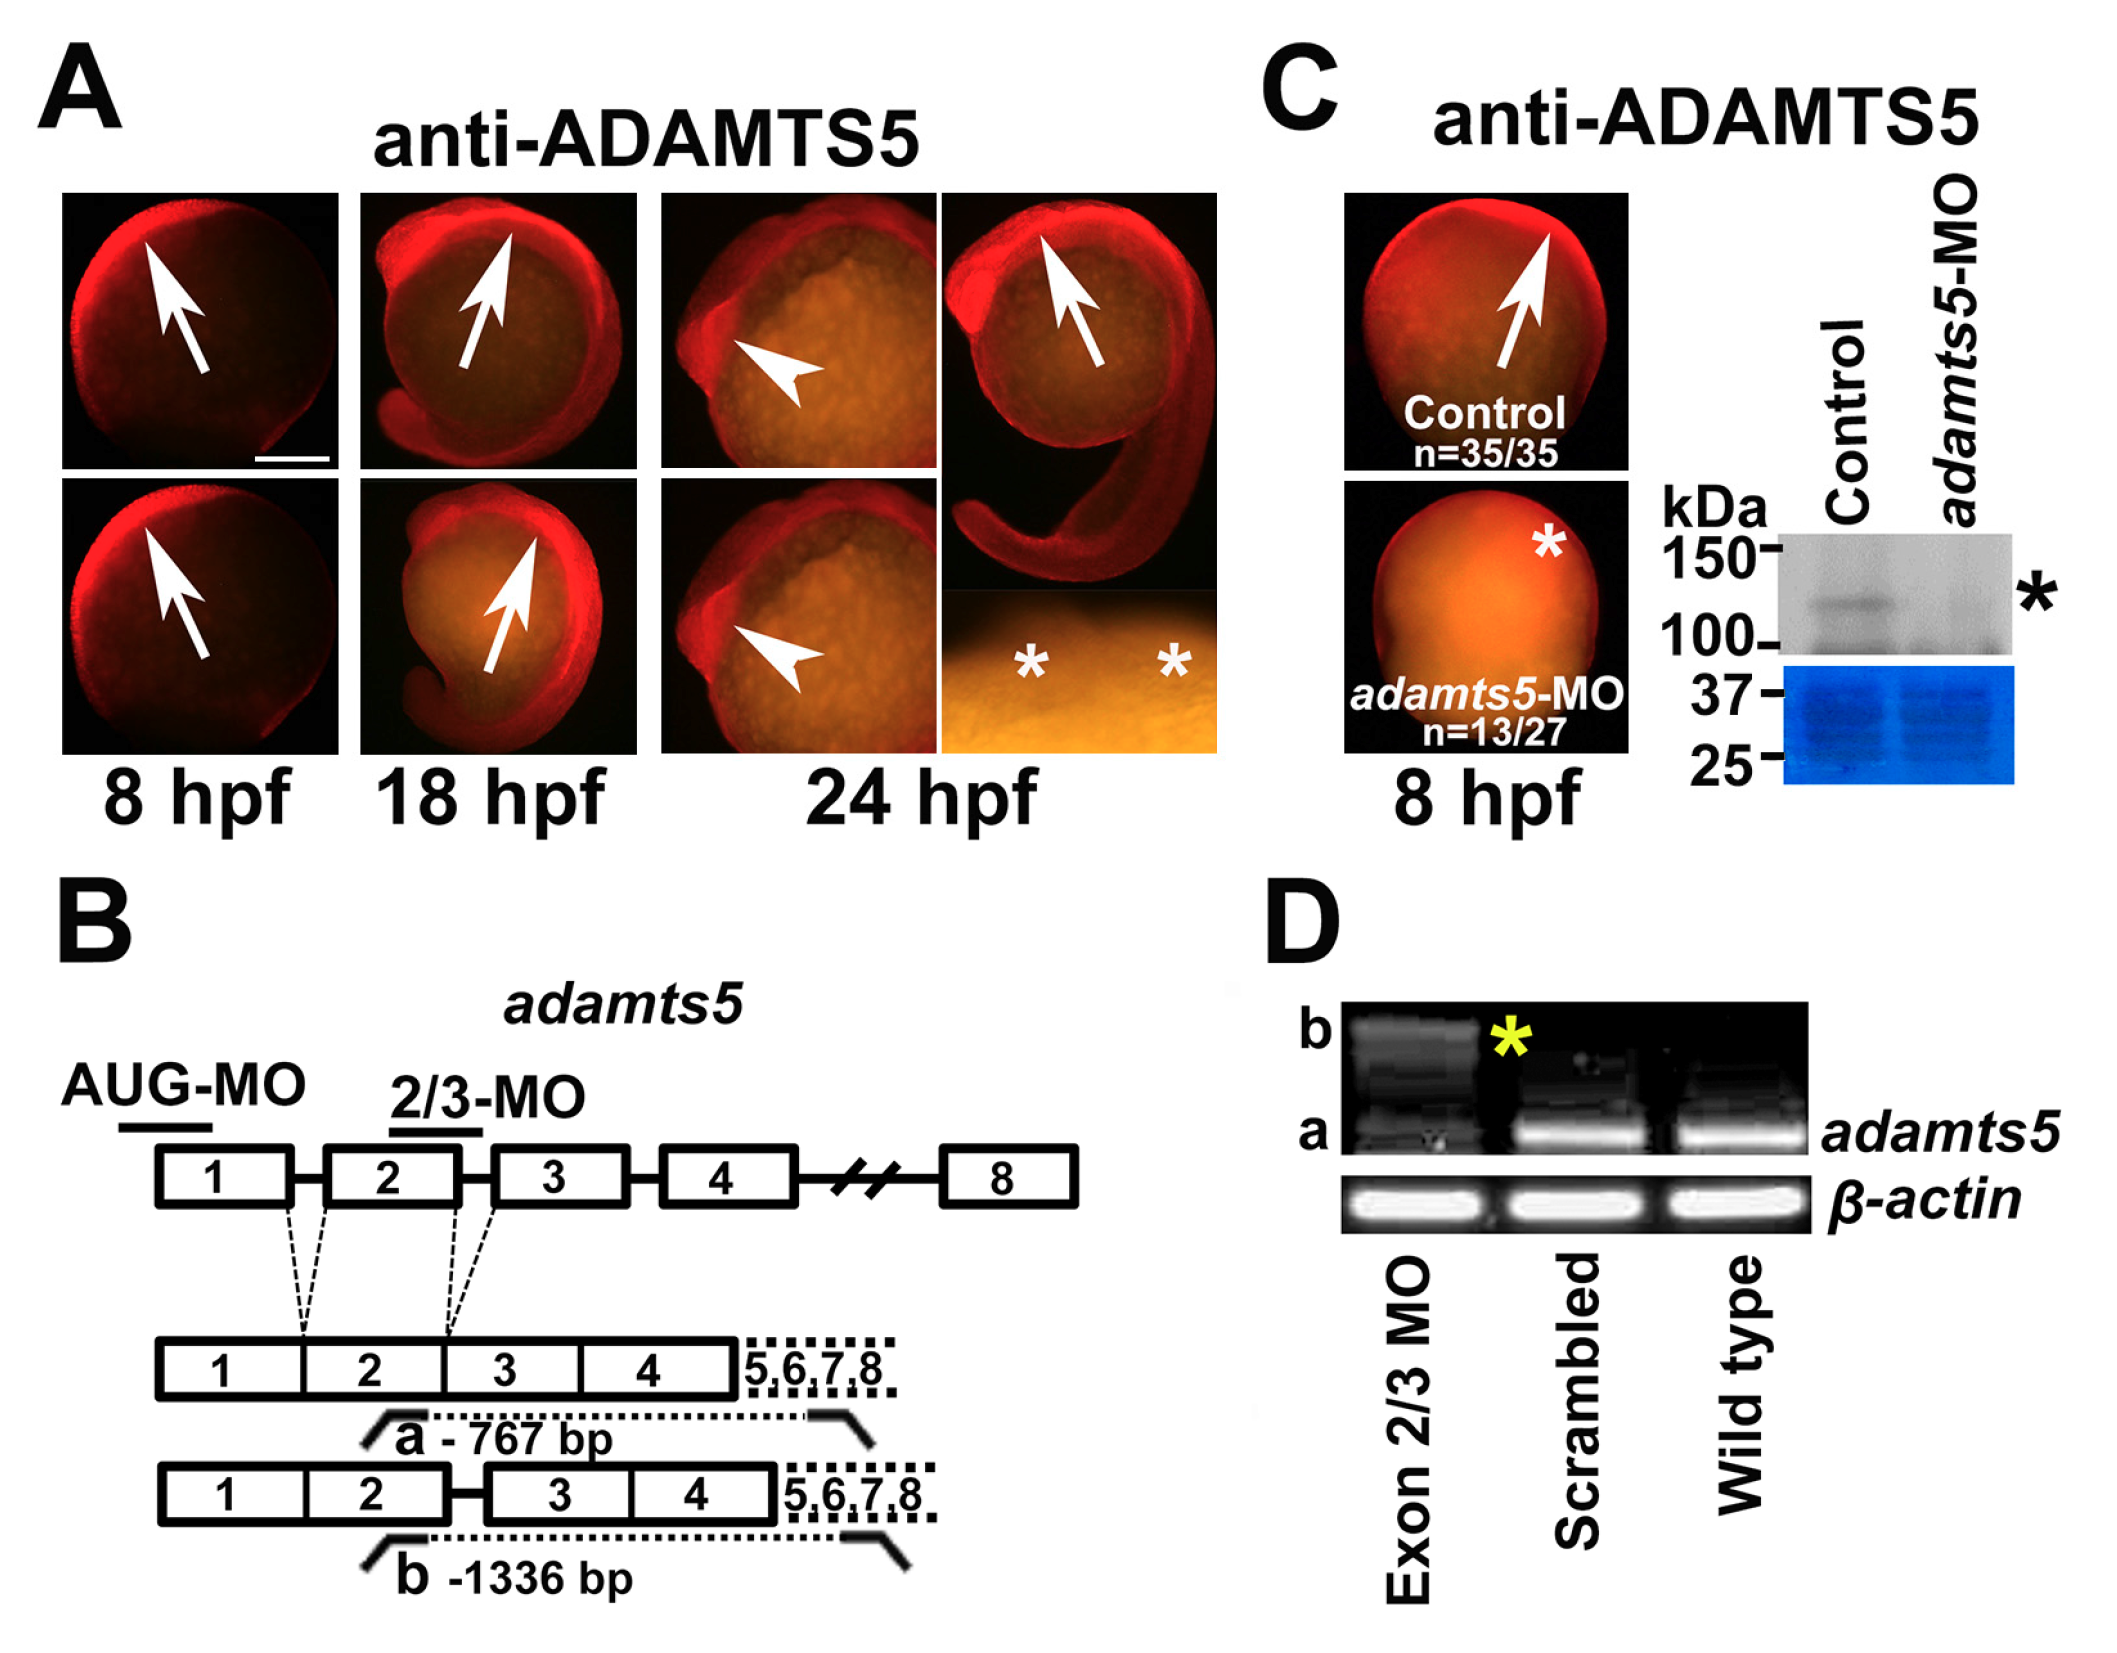
Fig. 1
Expression and silencing of adamts5 in zebrafish embryos. (A) ADAMTS5 expression in 8, 18 and 24 hpf wild-type embryos. Note strong early expression in the dorsal mesoendoderm (8 hpf, arrows) and variable expression ventrally (8 hpf, arrowhead), with later expression in the floor plate of the neural tube (18 and 24 hpf, arrows) and bilaterally in the prosencephalon (24 hpf, arrowheads). Asterisks = prosencephalon in no primary antibody control. Scale bar = 250 μm; (B) Schematic representation of the adamts5 gene structure targeted with antisense morpholino oligonucleotides (MO), and its subsequent splicing, indicating the primers used for RT-PCR and the size of the resultant products; (C) Reduced ADAMTS5 expression is seen in adamts5 AUG-MO injected embryos (asterisk) versus control (arrow) by whole-mount antibody labelling (left-hand panel) and Western blot (right-hand panel) showing the 120 kDa ADAMTS5 species (asterisk) with a region of the Coomassie blue stained gel shown below, demonstrating even loading; (D) RT-PCR of adamts5 mRNA obtained from 24 hpf embryos following injection of the adamts5 2/3-MO at the 1-cell stage, showing amplicons a and b (asterisk). β-actin was used as a house-keeping gene.
Acknowledgments
This image is the copyrighted work of the attributed author or publisher, and
ZFIN has permission only to display this image to its users.
Additional permissions should be obtained from the applicable author or publisher of the image.
Full text @ Int. J. Mol. Sci.