
Fig. 3
- ID
- ZDB-IMAGE-180621-84
- Genes
- Publication
- Emerson et al., 2017 - Neuronal expression patterns of the PlexinA family during zebrafish development
- All Figures
- Figures for Emerson et al., 2017
|
Fig. 3
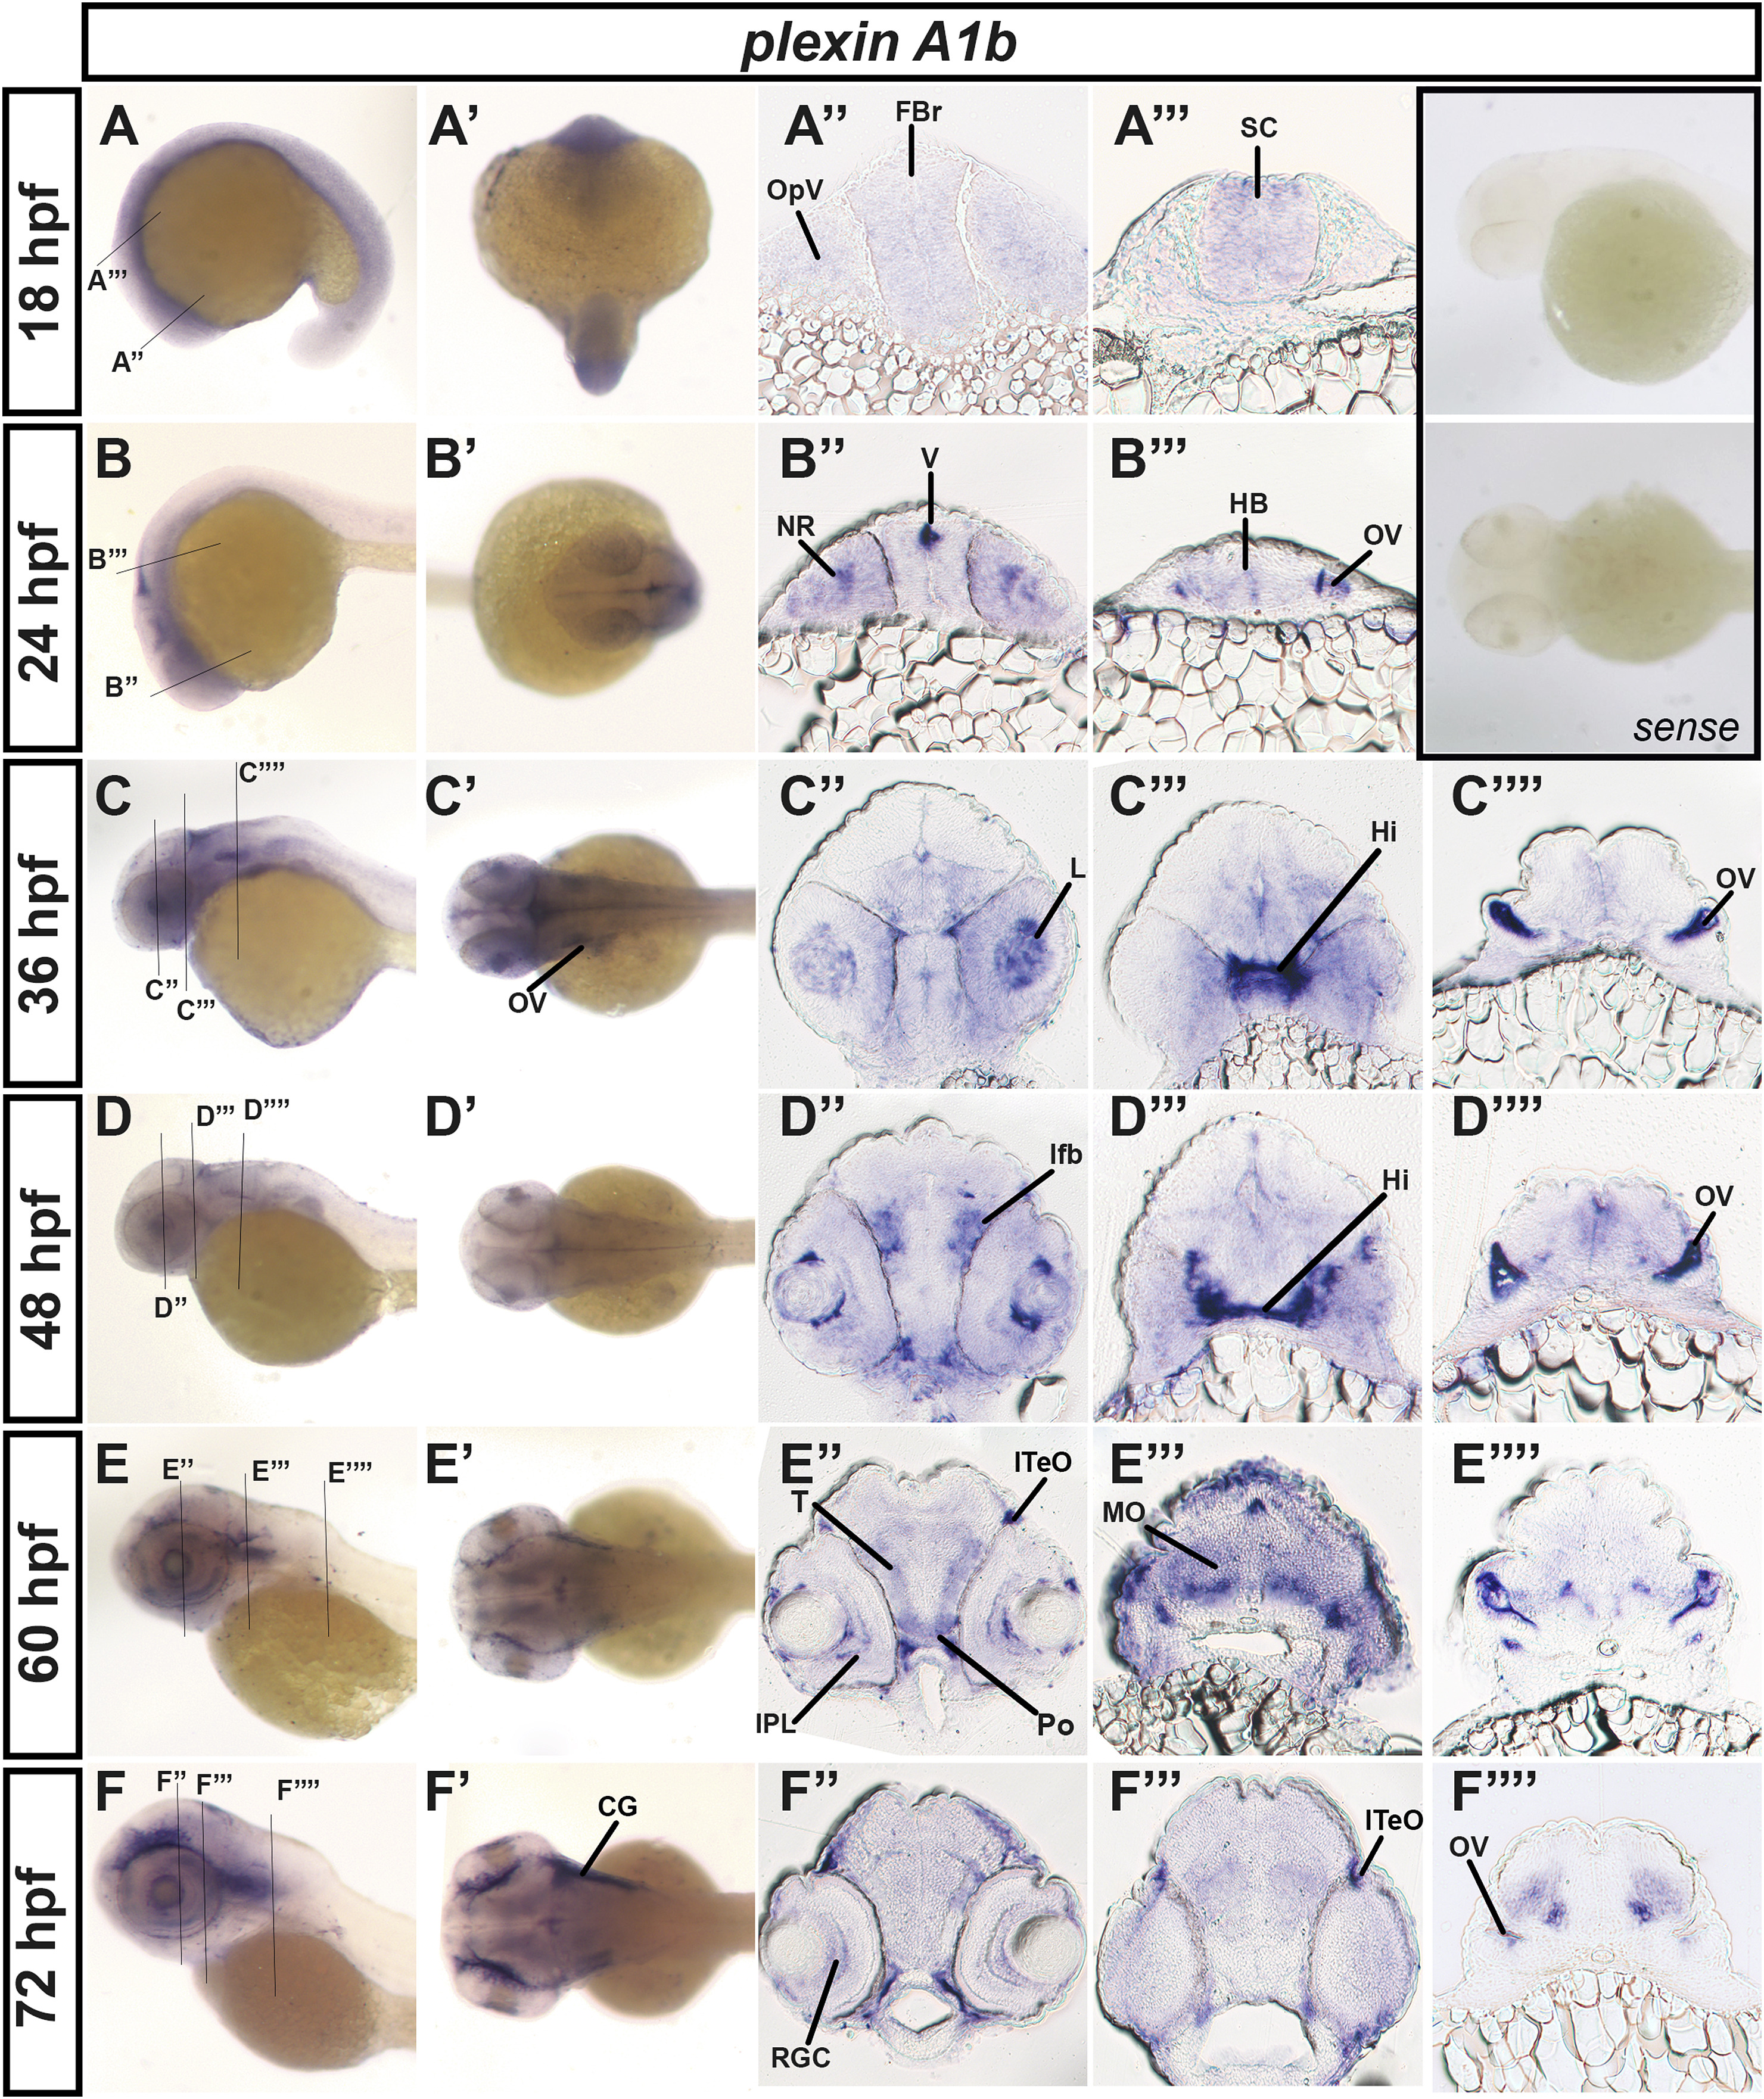
plxnA1b expression in the developing zebrafish.
Brightfield images of zebrafish embryos processed for in situ hybridization. (A-F) Whole-mount lateral, (A’-F’) whole-mount dorsal. Brightfield sections (A’’-F’’) forebrain, (A’’’-F’’’) midbrain and (C’’’’-F’’’’) hindbrain. Embryos were imaged at different developmental time points. (A-A’’’) 18 hpf, (B-B’’’) 24 hpf, (C-C’’’’) 36 hpf, (D-D’’’’) 48 hpf, (E-E’’’’) 60 hpf, and (F-F’’’’) 72 hpf. Lines in (A-F) indicate locations of the sections shown at that time-point. Inset shows sense probe control. Hpf-hours post fertilization, OpV- optic vesicle, Fbr, forebrain, SC- spinal cord, NR-neural retina, V- ventricle, HB- hindbrain, OV- otic vesicle, L-lens, Hi-intermediate hypothalamus, lfb-lateral forebrain bundle, Po-pre-optic region, T-thalamus, lTeO- lateral optic tectum, MO- medulla oblongata, RGC- retinal ganglion cell layer, IPL-inner plexiform layer, CG-cranial ganglia.
Reprinted from Gene expression patterns : GEP, 27, Emerson, S.E., Light, S.E., Ebert, A.M., Neuronal expression patterns of the PlexinA family during zebrafish development, 56-66, Copyright (2017) with permission from Elsevier. Full text @ Gene Expr. Patterns