
Fig. 7
- ID
- ZDB-IMAGE-180621-63
- Publication
- Suniaga et al., 2018 - Increased mechanical loading through controlled swimming exercise induces bone formation and mineralization in adult zebrafish
- All Figures
- Figures for Suniaga et al., 2018
|
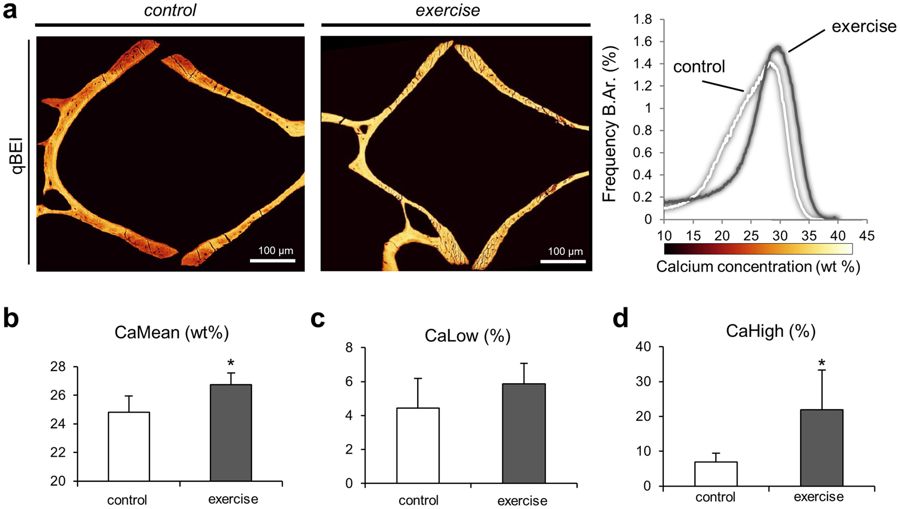
Fig. 7
Bone mineral density distribution in zebrafish bone. (a) Quantitative backscattered electron microscopy images (pseudo-colored) of zebrafish vertebrae from the control group (left) and the exercise group (center) indicate a higher degree of bone mineralization in exercised zebrafish. Histograms depicting the bone mineral density distribution in calcium weight percentages (right) yielded substantial differences between the groups. (b) Exercised zebrafish displayed higher mean calcium content (CaMean) than zebrafish from the control group. (c) The amount of bone with a calcium concentration below the 5% threshold (CaLow) remained unchanged between the groups. (d) The amount of bone mineralized above the 95% threshold (CaHigh) was significantly higher in the exercise group thus indicating an enhancement of bone mineralization in the exercise group.