
Fig. 2
- ID
- ZDB-IMAGE-180621-4
- Publication
- Chia et al., 2018 - Tumor initiating cells induce Cxcr4-mediated infiltration of pro-tumoral macrophages into the brain
- All Figures
- Figures for Chia et al., 2018
|
Fig. 2
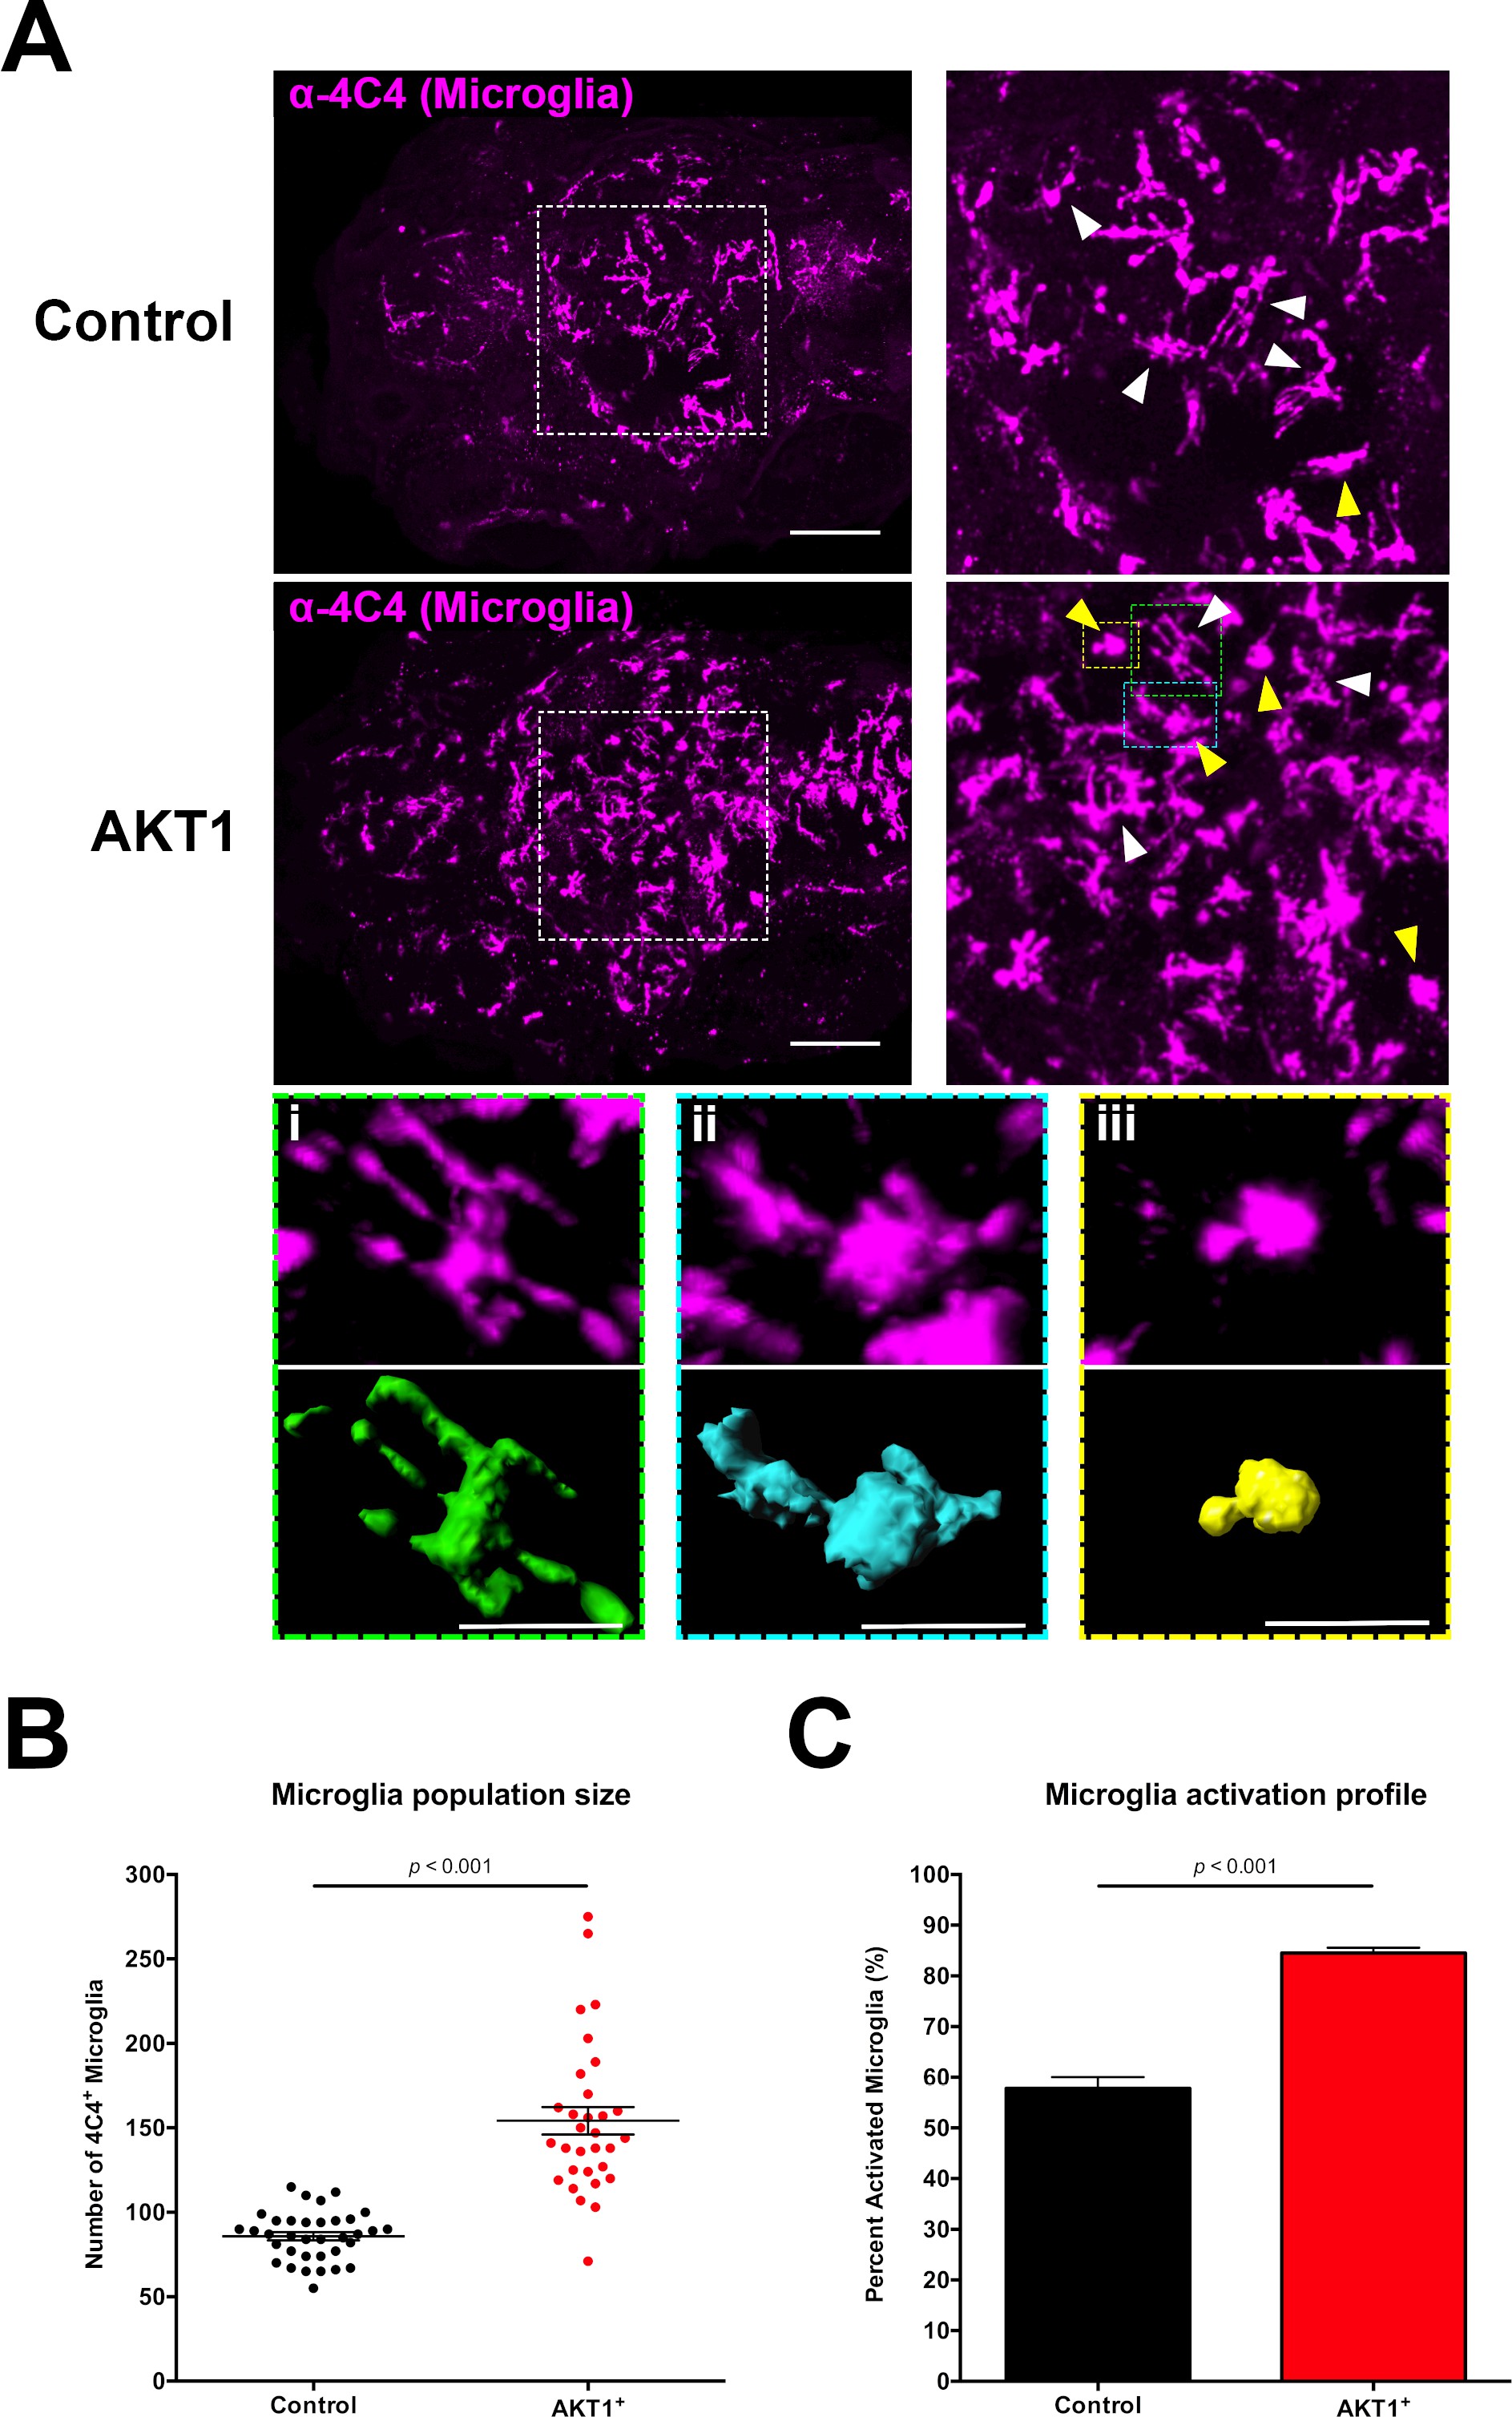
Induced transformation in AKT1-expressing cells leads to increased microglia numbers and microglial activation.
(A) Immunohistochemistry using the microglia-specific antibody (α−4C4) showed increased microglia numbers and increased microglial activation upon overexpression of AKT1. Representative confocal images of the larval zebrafish brain are shown. Upper panels: upon control RFP expression, lower panels: upon AKT1 overexpression. White arrows indicate ramified microglia; Yellow arrows indicate amoeboid microglia. (Ai)-(Aiii) Higher magnifications of cells in the green (i), blue (ii) and yellow (iii) outlined areas. Upper panel shows 4C4 immunohistochemistry, lower panel shows segmented images using the surface tool in Imaris. (i) Represents a ramified cell (surface/volume ratio ~1), (ii) shows an activated cell (surface/volume ratio ~0.8) and (iii) shows a fully activated (amoeboid) cell (surface/volume ratio ~0.6) (B) Quantification of the numbers of microglia in the brain in control and following AKT1 overexpression (Control: 85.8 ± 2.45, n = 35 larvae; Akt1: 154.2 ± 8.15, n = 31 larvae, p<0.001, N = 3). (C) Quantification of the percentage activation within the microglial population in control and AKT1-positive fish (Control: 57.8 ± 2.26%, n = 10 larvae; AKT1: 84.5 ± 1.07%, n = 14 larvae, p<0.001, N = 2). Error bars represent mean ±SEM. Images were captured using a Zeiss LSM710 confocal microscope with a 20X/NA 0.8 objective. Scale bars represent 100 µm.