
Fig. 1
- ID
- ZDB-IMAGE-180621-2
- Publication
- Chia et al., 2018 - Tumor initiating cells induce Cxcr4-mediated infiltration of pro-tumoral macrophages into the brain
- All Figures
- Figures for Chia et al., 2018
|
Fig. 1
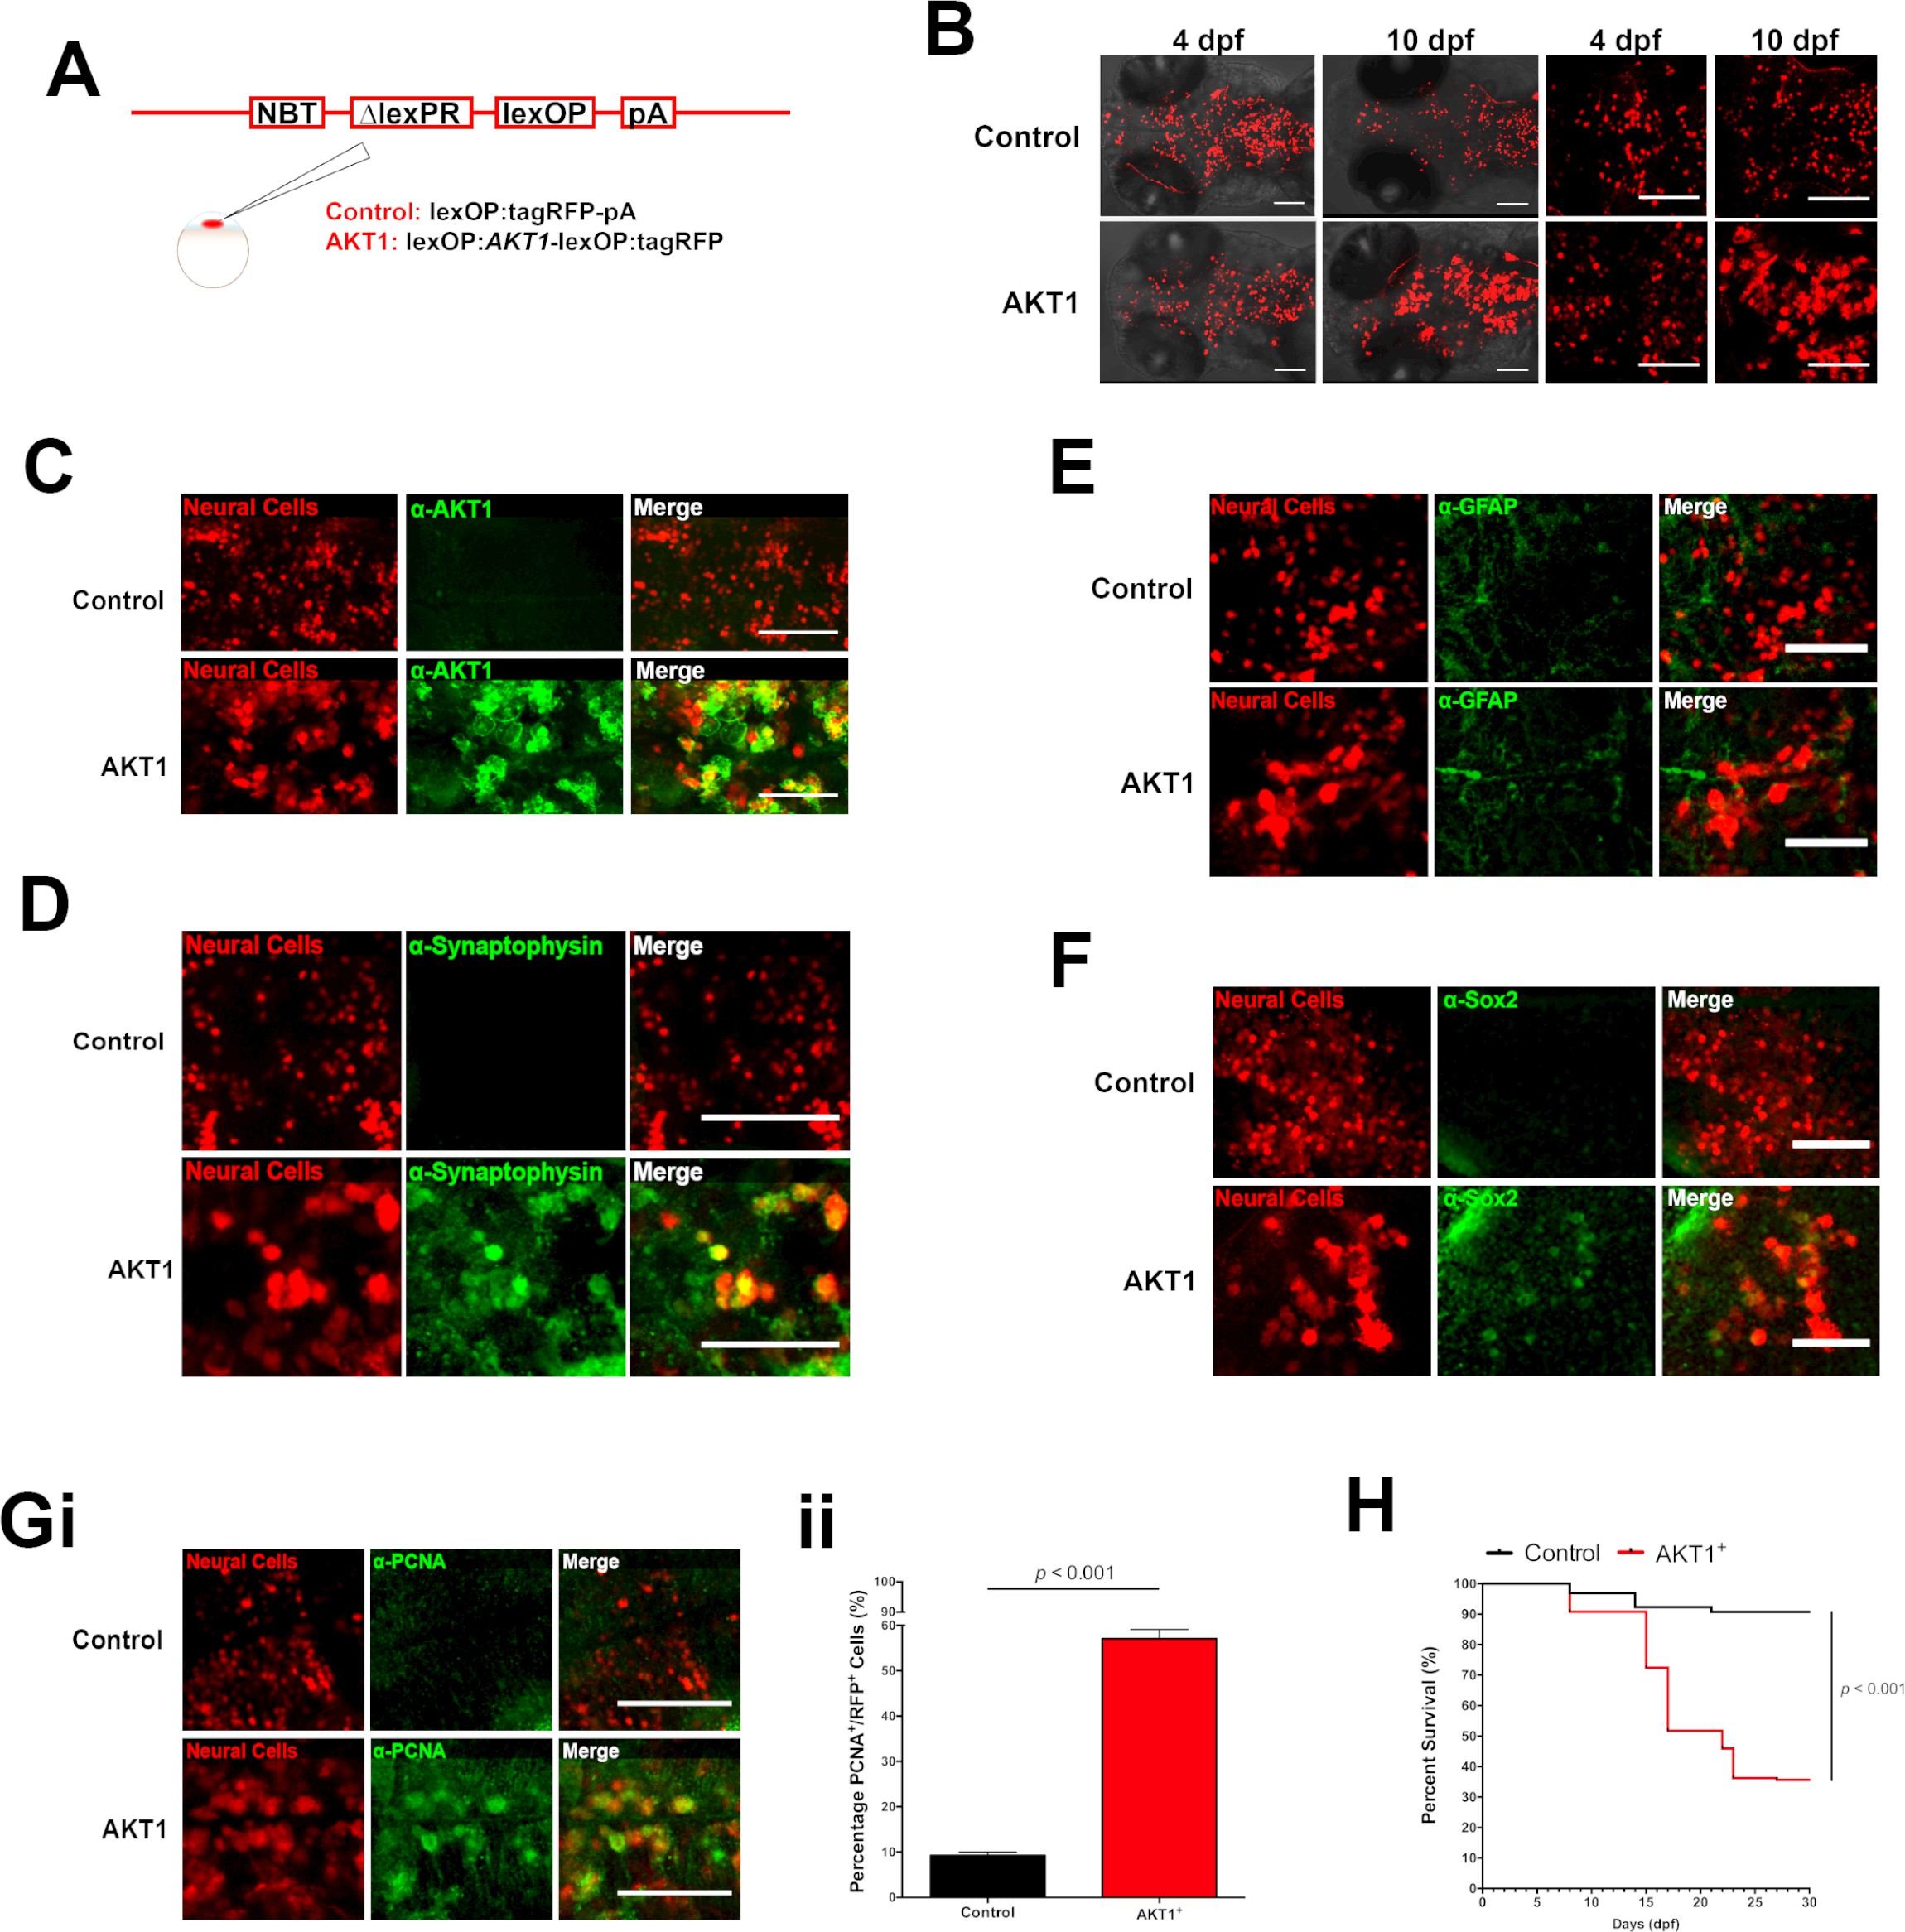
Human AKT1 induces transformation in the larval zebrafish brain.
(A) To achieve expression in neural cells under the NBT promoter, the NBT:∆LexPR-lexOP-pA zebrafish line was used. AKT1 expression was achieved through the injection of a lexOP:AKT1-lexOP:tagRFP into embryos at the one-cell stage. Control-RFP cells were obtained through the injection of a lexOP:tagRFP-pA. (B) In vivo imaging revealed early transformations and abnormal cellular morphology of AKT1-expressing cells in the brains of larval zebrafish from 4 dpf to 10 dpf. Representative confocal images of the larval zebrafish brain are shown. Upper panel: RFP control cells, lower panel: AKT1-expressing cells. (C) Immunohistochemistry revealed expression of the human AKT1 protein in AKT1-expressing cells, but not in control cells. Representative confocal images of the larval zebrafish brain at 8 dpf are shown. Upper panel: RFP control cells, lower panel: AKT1-expressing cells. (D) Immunohistochemistry revealed expression of the differentiation marker Synaptophysin in AKT1-expressing cells but not in control cells. Representative confocal images of the larval zebrafish brain at 8 dpf are shown. Upper panel: RFP control cells, lower panel: AKT1-expressing cells (E) Immunohistochemistry showed that neither AKT1-expressing cells nor control neural cells were positive for GFAP at 8 dpf. Representative confocal images of the larval zebrafish brain at 8 dpf are shown. Upper panel: RFP control cells, lower panel: AKT1-expressing cells. (F) Immunohistochemistry revealed that a subset of AKT1-expressing cells was positive for the stem cell marker Sox2 while neural control cells were negative. Representative confocal images of the larval zebrafish brain at 8 dpf are shown. Upper panel: RFP control cells, lower panel: AKT1-expressing cells. (Gi) Immunohistochemistry using the proliferation marker PCNA (proliferating cell nuclear antigen) revealed increased expression in AKT1-expressing cells compared to control cells. Representative confocal images of the larval zebrafish brain at 8 dpf are shown. Upper panel: RFP control cells, lower panel: AKT1 cells. (Gii) Quantification of the level of proliferation rates in RFP-positive neural cells in control and AKT1-positive fish, (Control: 9.2 ± 0.75%, n = 13 larvae; Akt1: 57.1 ± 2.03%, n = 17 larvae, p<0.001, N = 3) (H) Kaplan-Meier survival plot of control and AKT1 injected larvae over 30 days, n = 118/130, and 62/174 respectively. Error bars represent mean ± SEM. All images represent maximum intensity projections of confocal stacks. Images were captured using a Zeiss LSM710 confocal microscope with a 20X/NA 0.8 objective. Scale bars represent 100 µm.